Unlock a world of possibilities! Login now and discover the exclusive benefits awaiting you.
- Qlik Community
- :
- All Forums
- :
- QlikView App Dev
- :
- Bar chart every bar = 100%
- Subscribe to RSS Feed
- Mark Topic as New
- Mark Topic as Read
- Float this Topic for Current User
- Bookmark
- Subscribe
- Mute
- Printer Friendly Page
- Mark as New
- Bookmark
- Subscribe
- Mute
- Subscribe to RSS Feed
- Permalink
- Report Inappropriate Content
Bar chart every bar = 100%
Hello at all,
i want to build a bar chart which looks like that:
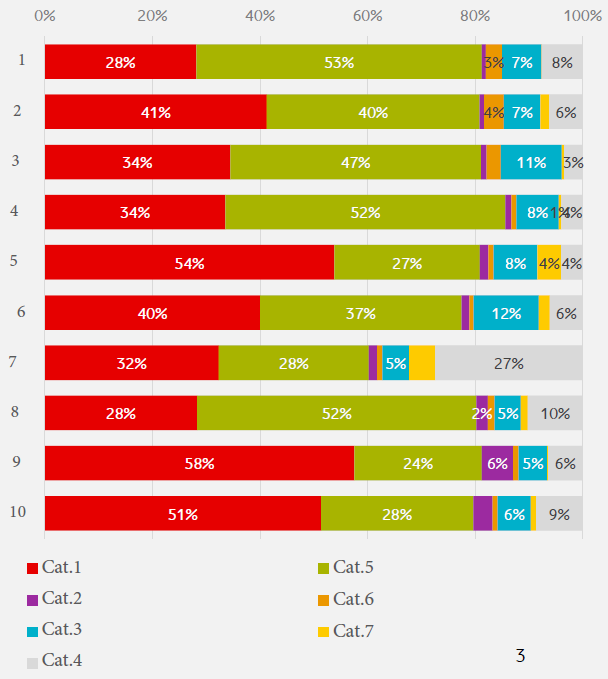
The bar chart shows the Datatraffic for different Sections (1-10) and in different Category. So the absolute Number of Datatraffic is in every Section different from the others. The Procent are based on the Datatraffic of one Section not of the Datatraffic in all Section. I hope it is understandable what i mean.
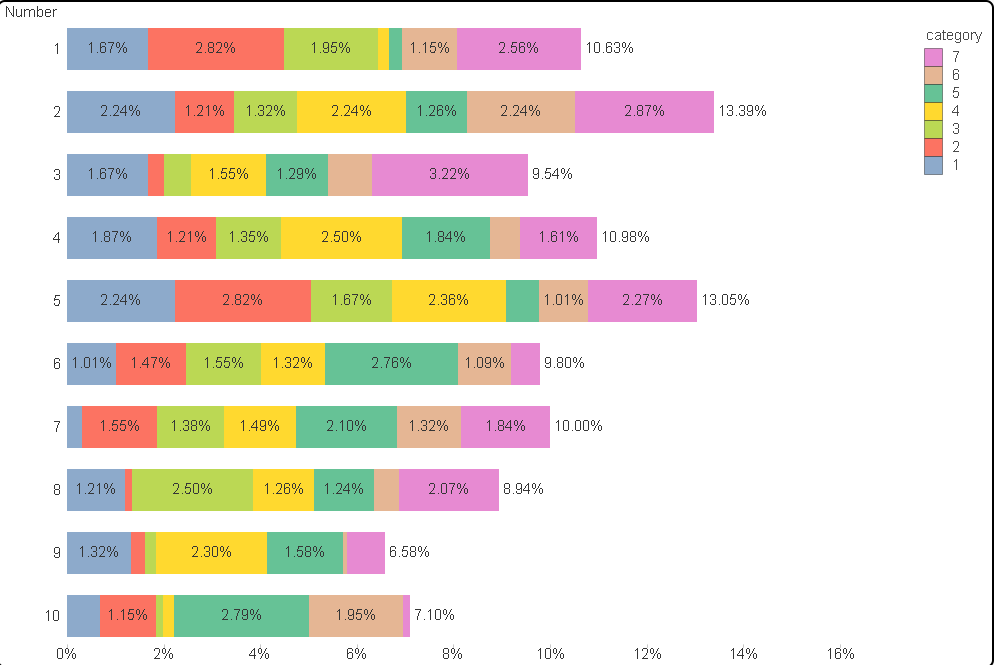
So if i try to build this bar chart in Qlikview the Procent are based of the whole Datatraffic:
Has anyone an idea how i can solve this Problem?
- Mark as New
- Bookmark
- Subscribe
- Mute
- Subscribe to RSS Feed
- Permalink
- Report Inappropriate Content
I think you are either using a relative option or an expression like this:
Count(Measure)/Count(TOTAL Measure)
In order to get what you want, you need to use something like this:
Count(Measure)/Count(TOTAL <Number> Measure)
I am assuming that your expression is Count(Measure).