Unlock a world of possibilities! Login now and discover the exclusive benefits awaiting you.
- Qlik Community
- :
- All Forums
- :
- QlikView App Dev
- :
- Check if two certain products are sold together ?
- Subscribe to RSS Feed
- Mark Topic as New
- Mark Topic as Read
- Float this Topic for Current User
- Bookmark
- Subscribe
- Mute
- Printer Friendly Page
- Mark as New
- Bookmark
- Subscribe
- Mute
- Subscribe to RSS Feed
- Permalink
- Report Inappropriate Content
Check if two certain products are sold together ?
Hi,
i got a sales table that looks like
| TransactionID | ProductID | Quantity | Value |
|---|---|---|---|
| 12-1234 | 1001 | 2 | 24.99 |
| 12-1234 | 1002 | 1 | 9.90 |
| 12-1255 | 1001 | 1 | 13 |
| 12-1344 | 1002 | 2 | 19.80 |
I have to build a "connection rate" report to show how often certain predefined products are sold together, for example count the transactions where products 1001 and 1002 are sold within the same transactionID.
In addition there is not only one connection rate defined but more than 10, so a hardcoded expression is not going to do it.
The bad thing is, I dont really know how and where to start.
Perhaps some of you already had a similar challenge and could give me some hints whether or not such an analysis is possible within qlikview
Thanks in advance,
Max
- « Previous Replies
-
- 1
- 2
- Next Replies »
- Mark as New
- Bookmark
- Subscribe
- Mute
- Subscribe to RSS Feed
- Permalink
- Report Inappropriate Content
So, finally it worked thank you two once again
- Mark as New
- Bookmark
- Subscribe
- Mute
- Subscribe to RSS Feed
- Permalink
- Report Inappropriate Content
I am glad that we were able to find a solution.
I would be interested to have a look at the final solution, could you upload it with some fake data?
Or, at least tell how exactly you used the SUM?
Best regards,
- Mark as New
- Bookmark
- Subscribe
- Mute
- Subscribe to RSS Feed
- Permalink
- Report Inappropriate Content
Hi Bilge
i tried it, but because of the size and complexity of my data modell (2GB with ~15 dimension and fact tables) i just can offer you a screenshot of the report and the expression:
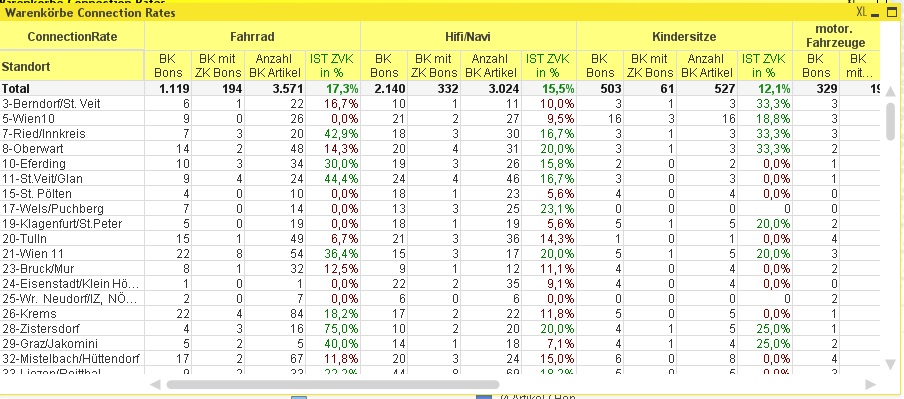
=sum(aggr(
if(count({($<Jahr=, Monat=, Tag=, Datum=, %KalenderDatum={'>=$(vMinDatum) <=$(vMaxDatum)'},GRUNDBEWEGUNGSART={'VERKAUF'}, ART_ARTIKELNR=P({1<ConnectionBK={'BK'}>} %ArtikelNr) >)} BelArtBelegNr)
* count({($<Jahr=, Monat=, Tag=, Datum=, %KalenderDatum={'>=$(vMinDatum) <=$(vMaxDatum)'},GRUNDBEWEGUNGSART={'VERKAUF'}, ART_ARTIKELNR=P({1<ConnectionZK={'ZK'}>} %ArtikelNr) >)} BelArtBelegNr),1,Null()
),ConnectionRate,BelArtBelegNr))
BK would be criteria1 and ZK the second one
- « Previous Replies
-
- 1
- 2
- Next Replies »