Unlock a world of possibilities! Login now and discover the exclusive benefits awaiting you.
- Qlik Community
- :
- All Forums
- :
- QlikView App Dev
- :
- Color background color based on column partial sum
- Subscribe to RSS Feed
- Mark Topic as New
- Mark Topic as Read
- Float this Topic for Current User
- Bookmark
- Subscribe
- Mute
- Printer Friendly Page
- Mark as New
- Bookmark
- Subscribe
- Mute
- Subscribe to RSS Feed
- Permalink
- Report Inappropriate Content
Color background color based on column partial sum
Using pivot tables, how do I do the following.
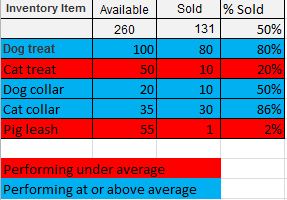
So, I want to color code the row depending on how it's % Sold is doing compared to the total average (partial sum)
So, for example, Cat Treat and Pig Leash have only sold 20% and 2% respectively while the overall average is 50% for all products, so it gets red.
So, I know I need something like this for my background colors........
if(total for column 3 >= column 3 for item, RED, BLUE)
Thank you so much.
Accepted Solutions
- Mark as New
- Bookmark
- Subscribe
- Mute
- Subscribe to RSS Feed
- Permalink
- Report Inappropriate Content
I think something like sum(total column(2) ) will not work.
Try
=if( sum(sold_count) / sum(available_count) >= sum(total sold_count)/sum(total available_count), red(), blue())
- Mark as New
- Bookmark
- Subscribe
- Mute
- Subscribe to RSS Feed
- Permalink
- Report Inappropriate Content
if % Sold is maybe calculated like
=sum(Sold) / sum(Available)
then your background color expression may look like
=if( sum(Sold) / sum(Available) >= sum(total Sold) / sum(total Available), red(), blue() )
Hope this helps,
Stefan
- Mark as New
- Bookmark
- Subscribe
- Mute
- Subscribe to RSS Feed
- Permalink
- Report Inappropriate Content
Kind of.
Here are the defs:
column(1) = Available = sum(available_count)
column(2) = Sold = sum(sold_count)
column(3) = % Sold = column(2) / column(1)
So, I went into the background color and put this in but it's not working as expected. It's all blue.
=if(column(2)/column(1) >= sum(total column(2)) / sum(total column(1)), red(), blue())
- Mark as New
- Bookmark
- Subscribe
- Mute
- Subscribe to RSS Feed
- Permalink
- Report Inappropriate Content
I think something like sum(total column(2) ) will not work.
Try
=if( sum(sold_count) / sum(available_count) >= sum(total sold_count)/sum(total available_count), red(), blue())
- Mark as New
- Bookmark
- Subscribe
- Mute
- Subscribe to RSS Feed
- Permalink
- Report Inappropriate Content
Thank you. That works!
I can start another post but I just tried making the pivot table a little more multi-dimensional by adding Sale Year to it, so now it looks like this:
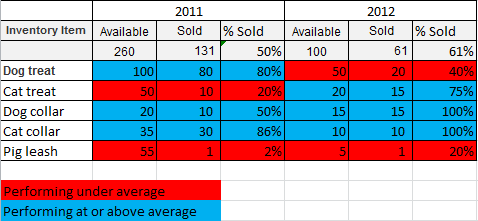
Using the formula above worked when it wasn't by year but now it appear the TOTAL portion of that expression totals all columns up? So, since the overall percentage is 53% (131+61/260+100), Dog collar in 2011 is showing up RED since it's below 53% but really it should be blue because it's above 50% for that specific year. Does that make sense?
Is there a way to get the partial sum for the column instead of the total sum for all the columns?
- Mark as New
- Bookmark
- Subscribe
- Mute
- Subscribe to RSS Feed
- Permalink
- Report Inappropriate Content
I think I figured it out. Need to add the column you want to group by after the total, so this:
=if( sum(sold_count) / sum(available_count) >= sum(total <TheYear> sold_count)/sum(total <TheYear> available_count), red(), blue())
Right?
- Mark as New
- Bookmark
- Subscribe
- Mute
- Subscribe to RSS Feed
- Permalink
- Report Inappropriate Content
Yes, should be correct. You can list the fields to ignore in the total, so you can still group by, using the <> syntax.
- Mark as New
- Bookmark
- Subscribe
- Mute
- Subscribe to RSS Feed
- Permalink
- Report Inappropriate Content
Please help me out here...