Unlock a world of possibilities! Login now and discover the exclusive benefits awaiting you.
- Qlik Community
- :
- All Forums
- :
- QlikView App Dev
- :
- Conditional data display on bar chart - how to mak...
- Subscribe to RSS Feed
- Mark Topic as New
- Mark Topic as Read
- Float this Topic for Current User
- Bookmark
- Subscribe
- Mute
- Printer Friendly Page
- Mark as New
- Bookmark
- Subscribe
- Mute
- Subscribe to RSS Feed
- Permalink
- Report Inappropriate Content
Conditional data display on bar chart - how to make it work?
I'm building a bar chart to show cash balance for each month in a given year - currently I have 2012 and 2013 balances showing. However the chart is showing balances for future months, when these should be null. I'm using set analysis formulas to sum the cash accounts over periods in a given year and 'Full Accumulation' is set so that the amount calculated in each display period is based on prior period balances - i.e. the accounting system that is the source of the data captures the change in balance in each period, so to get a total balance at any point in time I need to add the value (change) in that period to the sum of all prior periods.
Because of this logic, the chart shows ever-growing balances in future months. I want to create a condition that will return a null amount, or zero, in any month beyond the current one - e.g. if my data is populated through April 2013, I don't want to see bars in May - Dec 2013.
I've had a lot of frustration trying to figure out a way to do this with conditional expressions in the "Expressions" tab on Chart Properties.
Here's the chart:
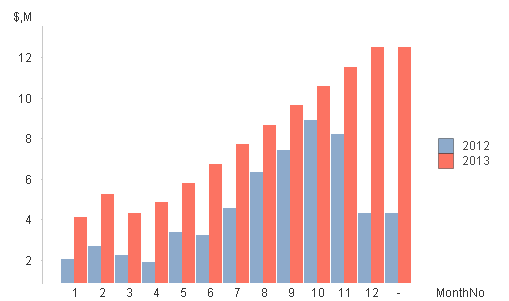
2012 calculations are correct - and the 2013 calculations are correct through April. After that they get out of control and are invalid. I just want the red bars to automatically disappear from the chart from period 5 onward (and when it's May, from period 6 onward, etc).
The formula used to calculate the balance is:
(Sum( { $
< $(eCashAccounts)
, Year = {2013}
, Quarter=
, Period=
, Month=
>}
[# Summary Amount]
)
+ $(=$(vCashBal_PeriodZeroYearParam(2013)))
) / Divisor
("Divisor" is a field used by the user to select 1000s, millions, etc).
The "eCashAccounts" variable is just a set that filters all of the general ledger accounts down to just the bank accounts.
the other variable, "vCashBal_PeriodZeroYearParam(2013)" is a parameterized variable that extracts the period zero cash balance - i.e. in each accounting year, there's an initial balance (period 0) that has to be added to the monthly amounts in order to get the final, ending balance. The formula is:
=Sum( { $
< $(eCashAccounts)
, Year = {$1}
, [Period (#)] = {0}
>}
[# Summary Amount]
)
I don't think either of these formulae are the issue - they work perfectly for 2012 and for months in 2013 up to the point where we have data. I just need help figuring out how to make the chart show nothing when the month on the chart exceeds the maximum month from the dataset (I have a variable, vMonthMax_Selected, for this).
For reference, here's the data model:
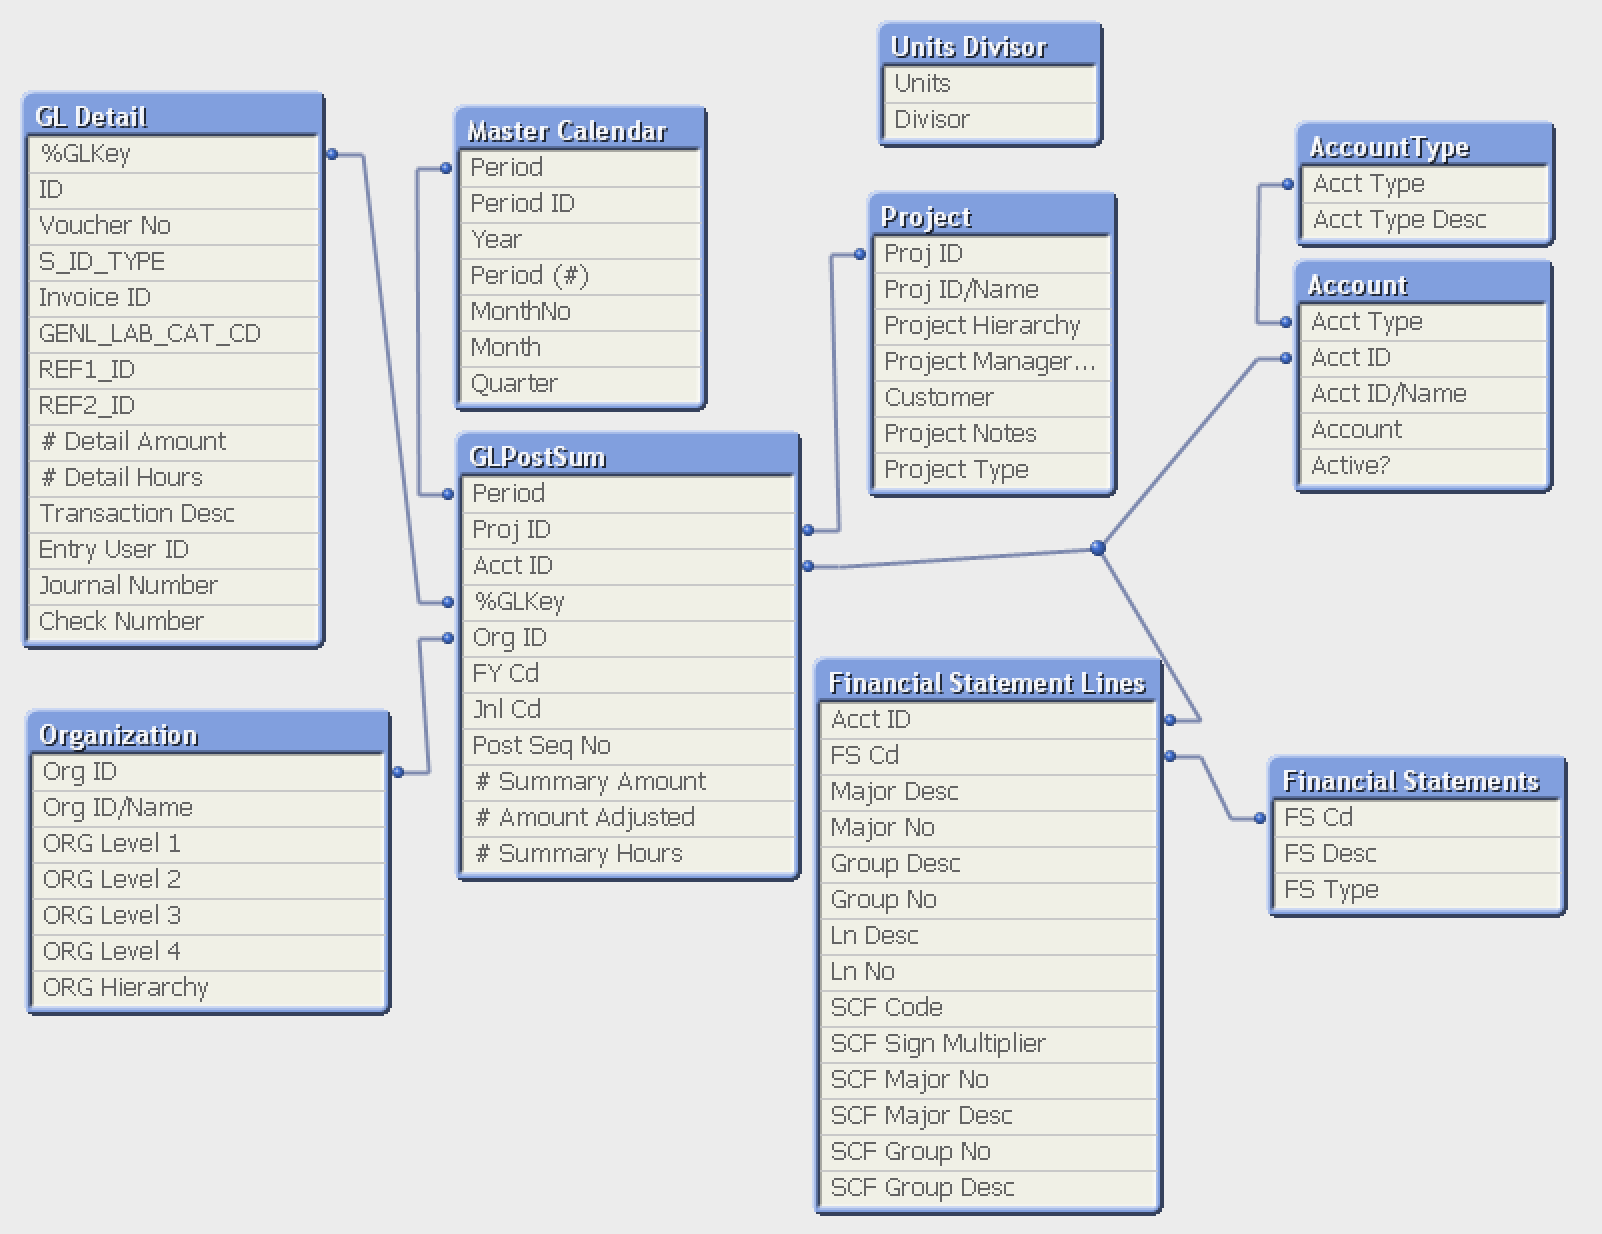
I appreciate any help!