Unlock a world of possibilities! Login now and discover the exclusive benefits awaiting you.
- Qlik Community
- :
- All Forums
- :
- QlikView App Dev
- :
- Re: Convert/Format Decimal to Appropriate Time
- Subscribe to RSS Feed
- Mark Topic as New
- Mark Topic as Read
- Float this Topic for Current User
- Bookmark
- Subscribe
- Mute
- Printer Friendly Page
- Mark as New
- Bookmark
- Subscribe
- Mute
- Subscribe to RSS Feed
- Permalink
- Report Inappropriate Content
Convert/Format Decimal to Appropriate Time
So I have found pieces of this discussion, but have not received a solution trying to put them all together.
I have data where the field is represented in minutes and then divided by another field to get an Average Handle Time of a call. I get results where the average is .73 minutes, 10.6 minutes, and 85 minutes as examples. I need these minutes broken out into proper Hours, Minutes, and Seconds.
So far I have tried some Time formatting and taking the results *60, but cannot solve formatting the final results to hh:mm:ss successfully. What am I doing wrong? I am assuming it's easiest to do this right away in the script?
- « Previous Replies
-
- 1
- 2
- Next Replies »
Accepted Solutions
- Mark as New
- Bookmark
- Subscribe
- Mute
- Subscribe to RSS Feed
- Permalink
- Report Inappropriate Content
May be this?
Table:
LOAD *,
Interval(KeepChar(Time, '0123456789.')/1440, 'h:mm:ss') as NewTime;
LOAD * Inline [
Time
0.73 minutes
10.6 minutes
85 minutes
];

- Mark as New
- Bookmark
- Subscribe
- Mute
- Subscribe to RSS Feed
- Permalink
- Report Inappropriate Content
Hi Jeremy,
Try the following formula: Timestamp(NUMBER, 'hh:mm:ss').
Regards,
H
- Mark as New
- Bookmark
- Subscribe
- Mute
- Subscribe to RSS Feed
- Permalink
- Report Inappropriate Content
Maybe
=Interval( Sum(Time) / Count(Calls) / ( 60 *24), 'hh:mm:ss')
- Mark as New
- Bookmark
- Subscribe
- Mute
- Subscribe to RSS Feed
- Permalink
- Report Inappropriate Content
May be this?
Table:
LOAD *,
Interval(KeepChar(Time, '0123456789.')/1440, 'h:mm:ss') as NewTime;
LOAD * Inline [
Time
0.73 minutes
10.6 minutes
85 minutes
];
- Mark as New
- Bookmark
- Subscribe
- Mute
- Subscribe to RSS Feed
- Permalink
- Report Inappropriate Content
Ok, so I would love to try some of these suggestions, thank all of you, but I am having an issue.
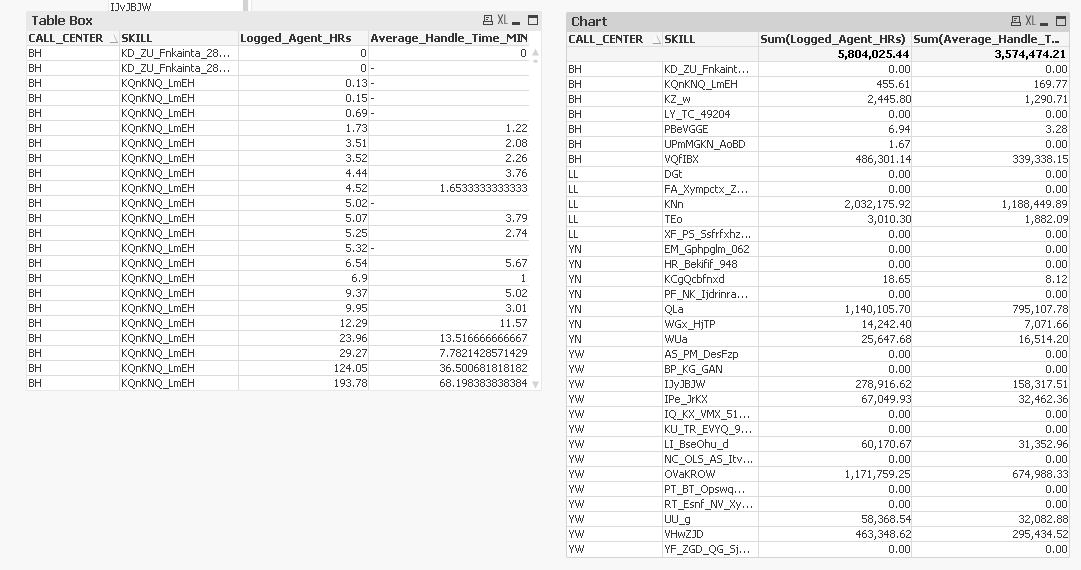
Can anyone tell me why it is not displaying all of my data in a chart, but it will in a table box? I have never had this issue. There is data under each CALL_CENTER and each SKILL, but the data will not display in my chart... I am working with 12k accounts, and I swear everything was displaying at one point, I even went as far as making the report over from scratch in case I altered the settings.
- Mark as New
- Bookmark
- Subscribe
- Mute
- Subscribe to RSS Feed
- Permalink
- Report Inappropriate Content
Since you have not used any aggregation (Sum or Avg or Min or Max or something else), your chart doesn't know what to show for places that have multiple values and ends up showing null. Using Sum, shows results
- Mark as New
- Bookmark
- Subscribe
- Mute
- Subscribe to RSS Feed
- Permalink
- Report Inappropriate Content
I thought there was a way to set it to just display the value instead of using an Aggregation function, but neither the thread nor the place for that discussion
- Mark as New
- Bookmark
- Subscribe
- Mute
- Subscribe to RSS Feed
- Permalink
- Report Inappropriate Content
So are your concerns resolved then?
- Mark as New
- Bookmark
- Subscribe
- Mute
- Subscribe to RSS Feed
- Permalink
- Report Inappropriate Content
You can use a straight table like a table box by using all fields you want to show as dimensions and disable 'suppress zero values' on presentation tab.
- Mark as New
- Bookmark
- Subscribe
- Mute
- Subscribe to RSS Feed
- Permalink
- Report Inappropriate Content
Hi,
maybe you mean to convert your Average_Handle_Time_MIN field in the script already?
Then maybe one solution might be also:

SER_CAMPAIGN:
LOAD
  ...
  IN_CALL+WRAPUP/SUCCESS_OPER_TRANSFERS        as Average_Handle_Time_MIN,
  Interval((IN_CALL+WRAPUP/SUCCESS_OPER_TRANSFERS)*'00:01') as Average_Handle_Time,
  ...

Resident SER_Opt;
hope this helps
regards
Marco
- « Previous Replies
-
- 1
- 2
- Next Replies »