Unlock a world of possibilities! Login now and discover the exclusive benefits awaiting you.
- Qlik Community
- :
- All Forums
- :
- QlikView App Dev
- :
- Count largest
- Subscribe to RSS Feed
- Mark Topic as New
- Mark Topic as Read
- Float this Topic for Current User
- Bookmark
- Subscribe
- Mute
- Printer Friendly Page
- Mark as New
- Bookmark
- Subscribe
- Mute
- Subscribe to RSS Feed
- Permalink
- Report Inappropriate Content
Count largest
Hello,
I would like to count how many largest value give 80% from all from subcategory.
Below I have a date sample :
| Name | Category | Subcategory | P1 |
| A | ZZZ | Other | 60,00 |
| B | ZZZ | Other 1 | 40,00 |
| C | XXX | Other 2 | 80,00 |
| D | XXX | Other 1 | 90,00 |
| E | ZZZ | Other 2 | 95,00 |
| F | XXX | Other 3 | 60,00 |
| G | ZZZ | Other 1 | 70,00 |
| H | XXX | Other 4 | 80,00 |
| I | ZZZ | Other 1 | 90,00 |
| J | XXX | Other | 100,00 |
Sum by category
| Other | 160,00 |
| Other 1 | 290,00 |
| Other 2 | 175,00 |
| Other 3 | 60,00 |
| Other 4 | 80,00 |
Max 1 form "Other" = 100
Max 2 form "Other" = 60
Other :
Count largest which give over 80% = 2 because ( 160*0,8=128 < 100 and 60 )
Other 1 :
290 *0,8 = 232
Count .. = 3 ( 90 , 70 , 90 ) because 232 =< 250 ( 90+70+90)
If someone could help I would be grateful !!
- Mark as New
- Bookmark
- Subscribe
- Mute
- Subscribe to RSS Feed
- Permalink
- Report Inappropriate Content
Take a look at this document: http://community.qlik.com/blogs/qlikviewdesignblog/2013/12/09/pareto-analysis
- Mark as New
- Bookmark
- Subscribe
- Mute
- Subscribe to RSS Feed
- Permalink
- Report Inappropriate Content
Yes I seen this post and it is useful but I don't see how can I manage 'largest' issue ?
- Mark as New
- Bookmark
- Subscribe
- Mute
- Subscribe to RSS Feed
- Permalink
- Report Inappropriate Content
Hi,
Check with the dimension limits tab of the chart properties.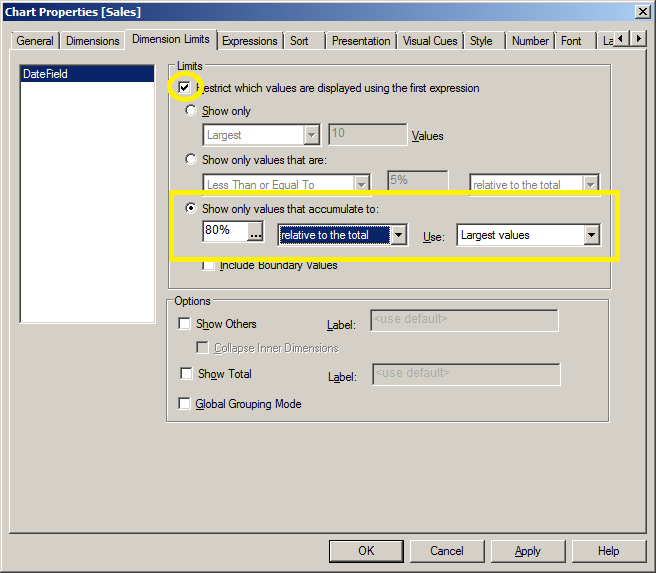
- Mark as New
- Bookmark
- Subscribe
- Mute
- Subscribe to RSS Feed
- Permalink
- Report Inappropriate Content
Welcome,
Thanks for your post.
I will need do more less something like below :
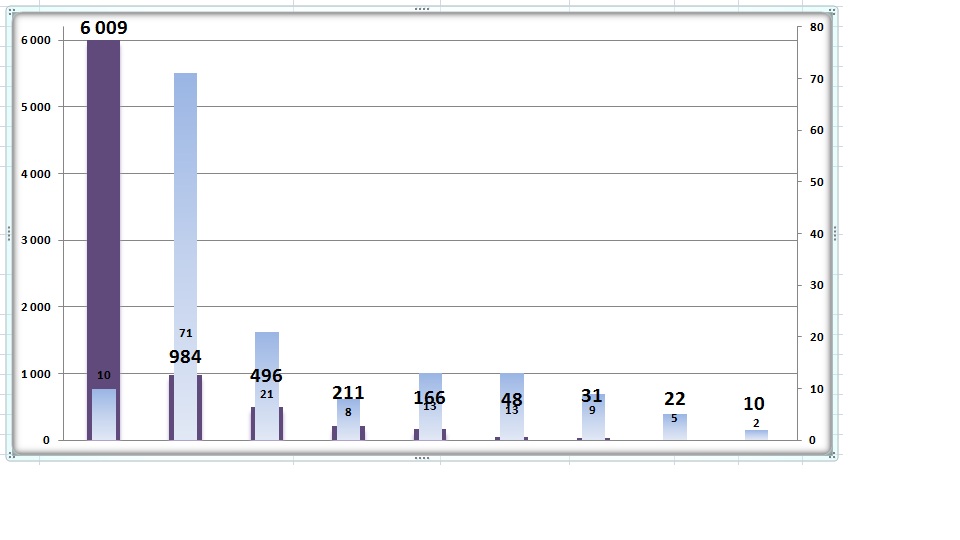
and dimension limits tab don't work for me.
I will need a set expression
- Mark as New
- Bookmark
- Subscribe
- Mute
- Subscribe to RSS Feed
- Permalink
- Report Inappropriate Content
The 80% in the article is the "largest" 80%.