Unlock a world of possibilities! Login now and discover the exclusive benefits awaiting you.
- Qlik Community
- :
- All Forums
- :
- QlikView App Dev
- :
- Re: Create straight table in QlikView script
- Subscribe to RSS Feed
- Mark Topic as New
- Mark Topic as Read
- Float this Topic for Current User
- Bookmark
- Subscribe
- Mute
- Printer Friendly Page
- Mark as New
- Bookmark
- Subscribe
- Mute
- Subscribe to RSS Feed
- Permalink
- Report Inappropriate Content
Create straight table in QlikView script
I want to take this:
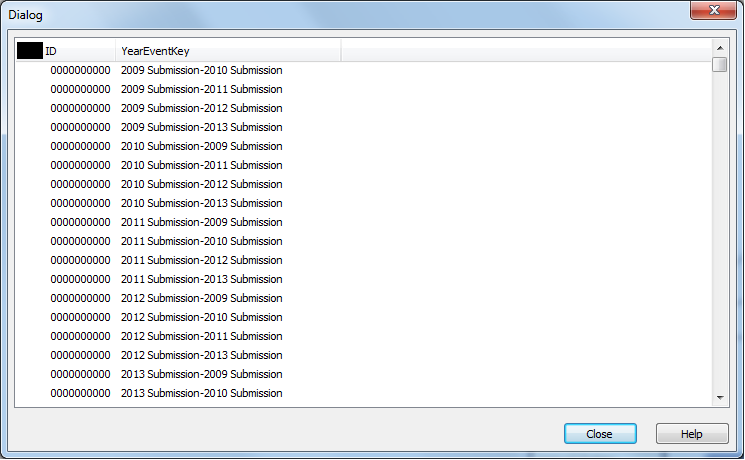
and count each respective distinct key, per key in the YearEventKey table, in a separate table... like this straight table output:
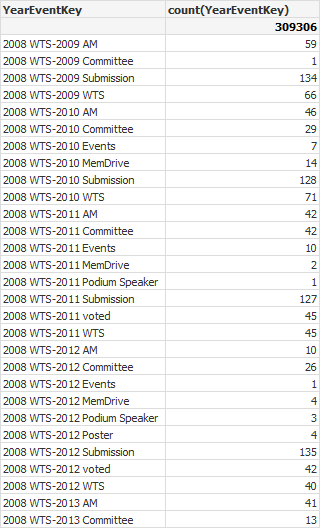
but I want to do it in the script. I need to be able to add this information to another table while the script is run. Is there a way I can get the distinct keys counted like the straight table but without having to export it as excel and re-import it?
Accepted Solutions
- Mark as New
- Bookmark
- Subscribe
- Mute
- Subscribe to RSS Feed
- Permalink
- Report Inappropriate Content
It looks like that table already exists in your script. Let's pretend it is called Table1:
Try something like this in your script:
Load
YearEventKey as YearEventKey_Grouping
, count(ID) as CountOfEach
Resident
Table1
GROUP
BY
YearEventKey;
This should create a table in your script with the YearEventKey_Grouping column, then a count column (CountOfEach)
- Mark as New
- Bookmark
- Subscribe
- Mute
- Subscribe to RSS Feed
- Permalink
- Report Inappropriate Content
Amazing. It Worked perfectly. Thank you very much. For some reason I didn’t think of counting inside the load script. Much Appreciated.