Unlock a world of possibilities! Login now and discover the exclusive benefits awaiting you.
- Qlik Community
- :
- All Forums
- :
- QlikView App Dev
- :
- Re: Creating a Combo Bar-Line Chart (Dual-Axis)
- Subscribe to RSS Feed
- Mark Topic as New
- Mark Topic as Read
- Float this Topic for Current User
- Bookmark
- Subscribe
- Mute
- Printer Friendly Page
- Mark as New
- Bookmark
- Subscribe
- Mute
- Subscribe to RSS Feed
- Permalink
- Report Inappropriate Content
Creating a Combo Bar-Line Chart (Dual-Axis)
Hello,
Thanks in advance. I am trying to create a combo bar-line chart, more specifically:
X Axis with Period (i.e. each month from 2012-2013)
The bar chart being represented with the number of transactions (each transaction has multiple line items, which are denoted by a transaction ID. I believe I have to sum these and then use the count function to get the Number of transactions? Please confirm).
The line chart being represented by the transaction amount.
Can someone please provide guidance on this? Currently I have:
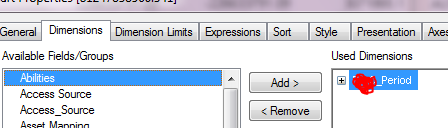
Where _Period = Period
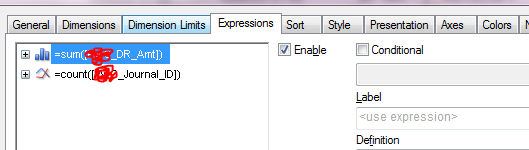
_DR_Amt = Transaction Amount
_Journal_ID = Transaction ID
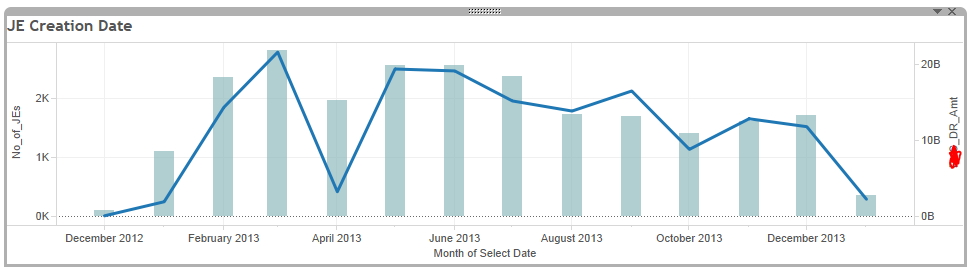
Below is a picture of what I want the graph to look like. This is taken from Tableau:
This is what I currently have appearing in Qlikview:
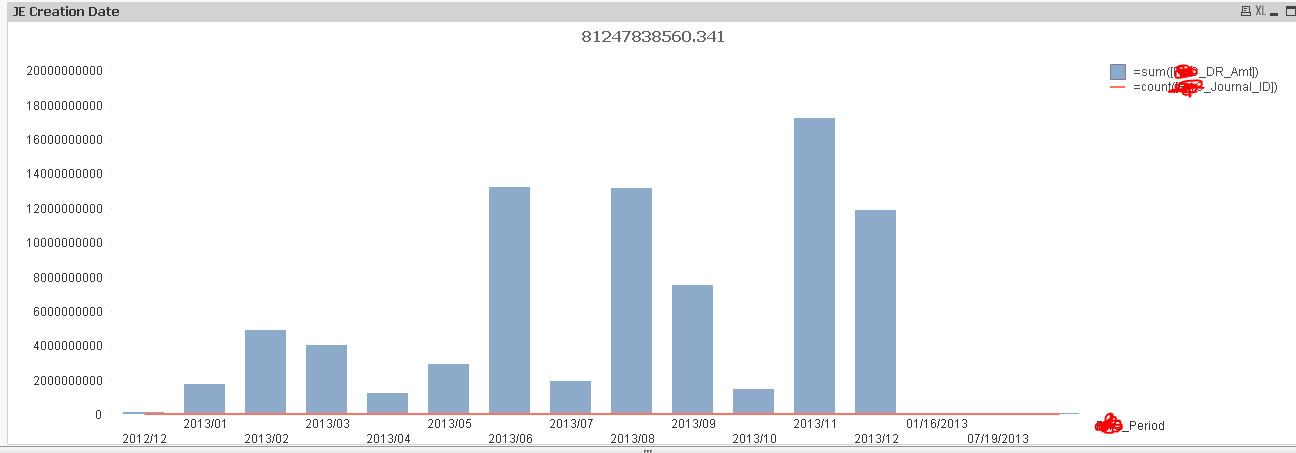
I am having trouble figuring out how to get the "dual axis" on my Qlikview. I believe that is hindering my line graph from appearing. I would appreciate if someone could let me know how to do this as well.
Thanks so much!
Ryan
- Mark as New
- Bookmark
- Subscribe
- Mute
- Subscribe to RSS Feed
- Permalink
- Report Inappropriate Content
On the Axes tab of your Chart's properties:
- Highlight the Expression whose axis you wish on the right
- For Position choose Right (Top)