Unlock a world of possibilities! Login now and discover the exclusive benefits awaiting you.
- Qlik Community
- :
- All Forums
- :
- QlikView App Dev
- :
- Customer Status
- Subscribe to RSS Feed
- Mark Topic as New
- Mark Topic as Read
- Float this Topic for Current User
- Bookmark
- Subscribe
- Mute
- Printer Friendly Page
- Mark as New
- Bookmark
- Subscribe
- Mute
- Subscribe to RSS Feed
- Permalink
- Report Inappropriate Content
Customer Status
I have a table that has the following
Customer ID
Status
Status StartDate
Status EndDate
There are 4 different status categories, Active, On Hold, Pending, Inactive.
How can I create charts that show the average duration that a customer stays in each category, and also a count of customers by status, over time?
Thanks!
Accepted Solutions
- Mark as New
- Bookmark
- Subscribe
- Mute
- Subscribe to RSS Feed
- Permalink
- Report Inappropriate Content
Take a look at the attached .qvw file. Make sure to look at the load script as I had to add to use IntervalMatch to add a calendar table to your start and end dates (the synthetic key that IntervalMatch creates is fine, and should be there). The charts should also be calculating what you're looking for.
- Mark as New
- Bookmark
- Subscribe
- Mute
- Subscribe to RSS Feed
- Permalink
- Report Inappropriate Content
You can calculate the duration by subtracting the StartDate from the EndDate. For example:
Load CustomerID,
Status,
Status StartDate,
Status EndDate,
interval([Status EndDate] - [Status StartDate],'d') as Duration
From ...mysource...;
You can then create a straight table object in the front end with Customer ID (and Status) as dimension(s) and as expression avg(Duration).
For counting customers by status over time you need to create reference dates for each status. See this blog post for an explanation of how to do that: Creating Reference Dates for Intervals
talk is cheap, supply exceeds demand
- Mark as New
- Bookmark
- Subscribe
- Mute
- Subscribe to RSS Feed
- Permalink
- Report Inappropriate Content
Thank you, this is a big help!
- Mark as New
- Bookmark
- Subscribe
- Mute
- Subscribe to RSS Feed
- Permalink
- Report Inappropriate Content
Thanks so much!
- Mark as New
- Bookmark
- Subscribe
- Mute
- Subscribe to RSS Feed
- Permalink
- Report Inappropriate Content
Please mark correct and helpful answers so others can find solutions to their problems too 
- Mark as New
- Bookmark
- Subscribe
- Mute
- Subscribe to RSS Feed
- Permalink
- Report Inappropriate Content
Hi,
Thanks for the reply.
I'm using personal edition, I can't open any qvd, can u please post the expression to plot chart.
Thanks in Advance
Pavan.
- Mark as New
- Bookmark
- Subscribe
- Mute
- Subscribe to RSS Feed
- Permalink
- Report Inappropriate Content
Load Script:
Data:
LOAD * INLINE [
Customer ID, Status, Status StartDate, Status EndDate
1, Active, 1/1/2014, 1/7/2014
1, On Hold, 1/8/2014, 1/10/2014
1, Pending, 1/11/2014, 1/20/2014
1, Inactive, 1/20/2014, 1/25/2014
2, Active, 1/1/2014, 1/10/2014
2, On Hold, 1/10/2014, 1/15/2014
2, Pending, 1/15/2014, 1/21/2014
2, Inactive, 1/21/2014,
];
//Finding min and max dates so we can create a calendar
MinAndMax:
LOAD RangeMin(min([Status StartDate]),min([Status EndDate])) as MinDate,
RangeMax(max([Status StartDate]),max([Status EndDate])) as MaxDate
RESIDENT Data;
let MinDate = num(Peek('MinDate'));
let MaxDate = num(Peek('MaxDate'));
DROP TABLE MinAndMax;
//Creating the calendar
Calendar:
Load Date($(MinDate)-1+iterno()) as Date autogenerate 1 While iterno() <= $(MaxDate)+1 - $(MinDate) ;
let MinDate = null();
let MaxDate = null();
//Joining the calendar dates using interval match to the start and end dates
IntervalMatch(Date)
LOAD [Status StartDate], [Status EndDate] RESIDENT Data;
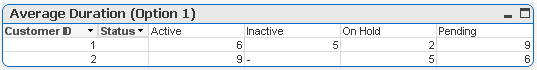
Type: Pivot Table
Dimension 1: Customer ID
Dimension 2: Status
Expression: avg([Status EndDate]-[Status StartDate])
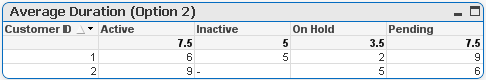
Type: Straight Table
Dimension: Customer ID
Expression 1: avg({<Status={'Active'}>}[Status EndDate]-[Status StartDate])
Expression 2: avg({<Status={'Inactive'}>}[Status EndDate]-[Status StartDate])
Expression 3: avg({<Status={'On Hold'}>}[Status EndDate]-[Status StartDate])
Expression 4: avg({<Status={'Pending'}>}[Status EndDate]-[Status StartDate])
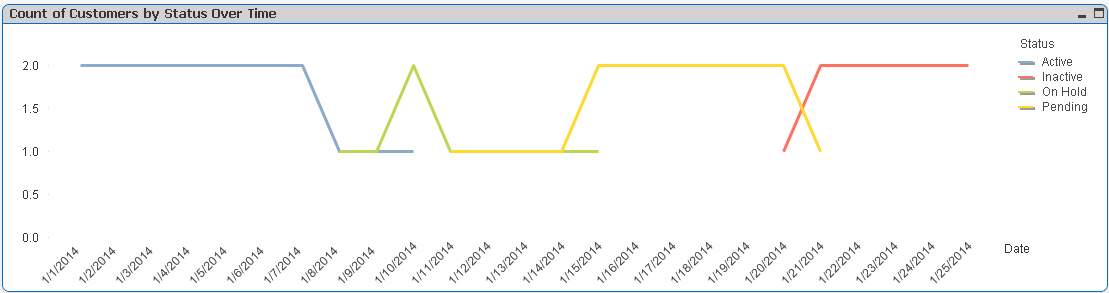
Type: Line Chart
Dimension 1: Date
Dimension 2: Status
Expression: count([Customer ID])