Unlock a world of possibilities! Login now and discover the exclusive benefits awaiting you.
- Qlik Community
- :
- All Forums
- :
- QlikView App Dev
- :
- Decile or Fractile Issue
- Subscribe to RSS Feed
- Mark Topic as New
- Mark Topic as Read
- Float this Topic for Current User
- Bookmark
- Subscribe
- Mute
- Printer Friendly Page
- Mark as New
- Bookmark
- Subscribe
- Mute
- Subscribe to RSS Feed
- Permalink
- Report Inappropriate Content
Decile or Fractile Issue
Hi all,
I want to do a decile or Fractile analysis.
Consumers will be divided into 10 groups.
for the segmentation, consumers will rank by their profits first.
first group contributes 10% profits to the total Profilts.
then the table will show how many consumers contribute the first 10% profits.
Second one contributes next 10% profits to the total profits.
and so on.
I find one formula from other discussion.
=if(
Profit <= fractile(TOTAL Profit, 0.1), '90-100%',
if(Profit <= fractile(TOTAL Profit, 0.2), '80-90%',
if(Profit <= fractile(TOTAL Profit, 0.3), '70-80%',
if(Profit <= fractile(TOTAL Profit, 0.4), '60-70%',
if(Profit <= fractile(TOTAL Profit, 0.5), '50-60%',
if(Profit <= fractile(TOTAL Profit, 0.6), '40-50%',
if(Profit <= fractile(TOTAL Profit, 0.7), '30-40%',
if(Profit <= fractile(TOTAL Profit, 0.8), '20-30%',
if(Profit <= fractile(TOTAL Profit, 0.9), '10-20%', '0-10%')))))))))
but this formula didn't rank the consumers first.
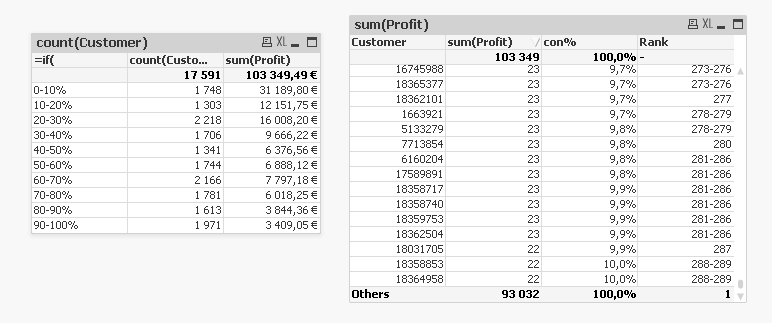
for the attach qv, you can find the customer number in 0-10% group is 1748 but from the table right, you can find the correct number should be 289 if rank the customer by profit first.
is there any expert who can help fix the issue and help me find the right way out?
- Mark as New
- Bookmark
- Subscribe
- Mute
- Subscribe to RSS Feed
- Permalink
- Report Inappropriate Content
use this expression sum( Sales) / Sum(TOTAL sales)
1. Create a new pivot table with one dimension.
2. Add the following expressions:
Sales $ Sum(Sales)
Total Sales % Sum(Sales) / Sum(TOTAL Sales)
% Sales by
Country Sum(Sales) / Sum(TOTAL<Country> Sales)
3. On the Presentation tab, select the dimension and turn on Show Partial Sums.
4. On the Number tab, set the format for the first expression to Integer. Set the second
and third expression to Fixed to 2 decimals, and turn on Show in Percent (%).
5. Click on Finish to save the chart.
6. Right-click on the Country field in the pivot table, and select Expand all from the
menu to show all the cities:
7. Resize the chart to see all of the values.
HTH
Vikas
If the issue is solved please mark the answer with Accept as Solution & like it.
If you want to go quickly, go alone. If you want to go far, go together.