Unlock a world of possibilities! Login now and discover the exclusive benefits awaiting you.
- Qlik Community
- :
- All Forums
- :
- QlikView App Dev
- :
- Re: Detach a expression in chart
- Subscribe to RSS Feed
- Mark Topic as New
- Mark Topic as Read
- Float this Topic for Current User
- Bookmark
- Subscribe
- Mute
- Printer Friendly Page
- Mark as New
- Bookmark
- Subscribe
- Mute
- Subscribe to RSS Feed
- Permalink
- Report Inappropriate Content
Detach a expression in chart
Hi All,
I'm trying to detach one expression in the line chart so that it always shows entire value, whereas other expression varies by selection.
EG:
in the attached example, when i select A, i want one expression to show all ID values but other expression to show all values so i can see trend.
Accepted Solutions
- Mark as New
- Bookmark
- Subscribe
- Mute
- Subscribe to RSS Feed
- Permalink
- Report Inappropriate Content
Change the expression to sum({<ID>}Value) or sum({1}Value). To ignore selections in all fields use {1}. To ignore selections only in the field ID use {<ID>}.
talk is cheap, supply exceeds demand
- Mark as New
- Bookmark
- Subscribe
- Mute
- Subscribe to RSS Feed
- Permalink
- Report Inappropriate Content
Ignore selection in ID
Sum({<ID>} Value)

- Mark as New
- Bookmark
- Subscribe
- Mute
- Subscribe to RSS Feed
- Permalink
- Report Inappropriate Content
GD,
When i try the above logic, it just disappears in full value color,
Trying to separate both colors (may be making one a bit transparent..but not working)
- Mark as New
- Bookmark
- Subscribe
- Mute
- Subscribe to RSS Feed
- Permalink
- Report Inappropriate Content
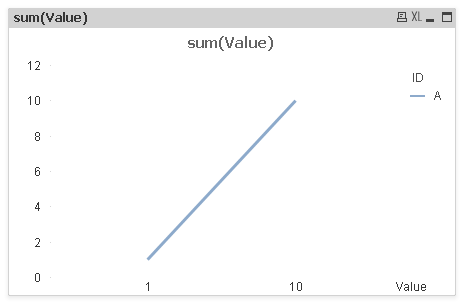
as I see each ID has two values
do you want to see both values e.g. when you select ID = A
like this: to achieve this you can define Value as second Dimension and sum(Value) as Expression)
or you the second chart? just promote Value to first place
or how your Chart should look like? ^
^
- Mark as New
- Bookmark
- Subscribe
- Mute
- Subscribe to RSS Feed
- Permalink
- Report Inappropriate Content
It worked.
Thanks 
- Mark as New
- Bookmark
- Subscribe
- Mute
- Subscribe to RSS Feed
- Permalink
- Report Inappropriate Content
It worked.
Thanks again sunny bro.
- Mark as New
- Bookmark
- Subscribe
- Mute
- Subscribe to RSS Feed
- Permalink
- Report Inappropriate Content
Thanks sir