Unlock a world of possibilities! Login now and discover the exclusive benefits awaiting you.
- Qlik Community
- :
- All Forums
- :
- QlikView App Dev
- :
- Re: Distinct Set Analysis
- Subscribe to RSS Feed
- Mark Topic as New
- Mark Topic as Read
- Float this Topic for Current User
- Bookmark
- Subscribe
- Mute
- Printer Friendly Page
- Mark as New
- Bookmark
- Subscribe
- Mute
- Subscribe to RSS Feed
- Permalink
- Report Inappropriate Content
Distinct Set Analysis
Hi!
i would like to setup the follwing set analysis statement for calculation.
i have three objects;
1Artikel.Artikelnr
2Artikel.Stocklevel
3.Artikel.Listprice
In my QV app Artikel.Artikelnr can appear multiple sames on the same nr.
| Artnr | Stocklevel | Listprice |
|---|---|---|
001 | 40 | 10 |
| 001 | 40 | 10 |
there my calculations are wrong, it should be 400 not 800.
so what i am trying to achieve is the following
sum(distinct(Article.Artikelnr(Artikel.Stocklevel * Artikel.Listprice))
it is however still returning values that are too high.
is there anotherway to wrtie the statement, set analysis perhaps that can be used in a pivot table and still be dynamic?
Best,
Bradley
Accepted Solutions
- Mark as New
- Bookmark
- Subscribe
- Mute
- Subscribe to RSS Feed
- Permalink
- Report Inappropriate Content
Try this:
Sum(
Aggr(
DISTINCT
Max(Artikel.Stocklevel) * Max(Artikel.Listprice)
,
Article.Artikelnr
)
)
- Mark as New
- Bookmark
- Subscribe
- Mute
- Subscribe to RSS Feed
- Permalink
- Report Inappropriate Content
Hi,
Remove the duplicate rows in script by using
LOAD DISTINCT
*
FROM Datasource;
OR
Use this expression
sum(Aggr(Max(Artikel.Stocklevel) * Max(Artikel.Listprice), Article.Artikelnr))
Hope this helps you.
Regards,
Jagan.
- Mark as New
- Bookmark
- Subscribe
- Mute
- Subscribe to RSS Feed
- Permalink
- Report Inappropriate Content
Try
avg(Artikel.Stocklevel * Artikel.Listprice)
or
sum(Artikel.Stocklevel * Artikel.Listprice) / count(Article.Artikelnr)
- Mark as New
- Bookmark
- Subscribe
- Mute
- Subscribe to RSS Feed
- Permalink
- Report Inappropriate Content
try this
Aggr(sum(Artikel.Stocklevel * Artikel.Listprice), Article.Artikelnr)
- Mark as New
- Bookmark
- Subscribe
- Mute
- Subscribe to RSS Feed
- Permalink
- Report Inappropriate Content
Thanks for the reply.
However this did not solve our problem;
i have pasted a picture to show you the phenomenon we are facing 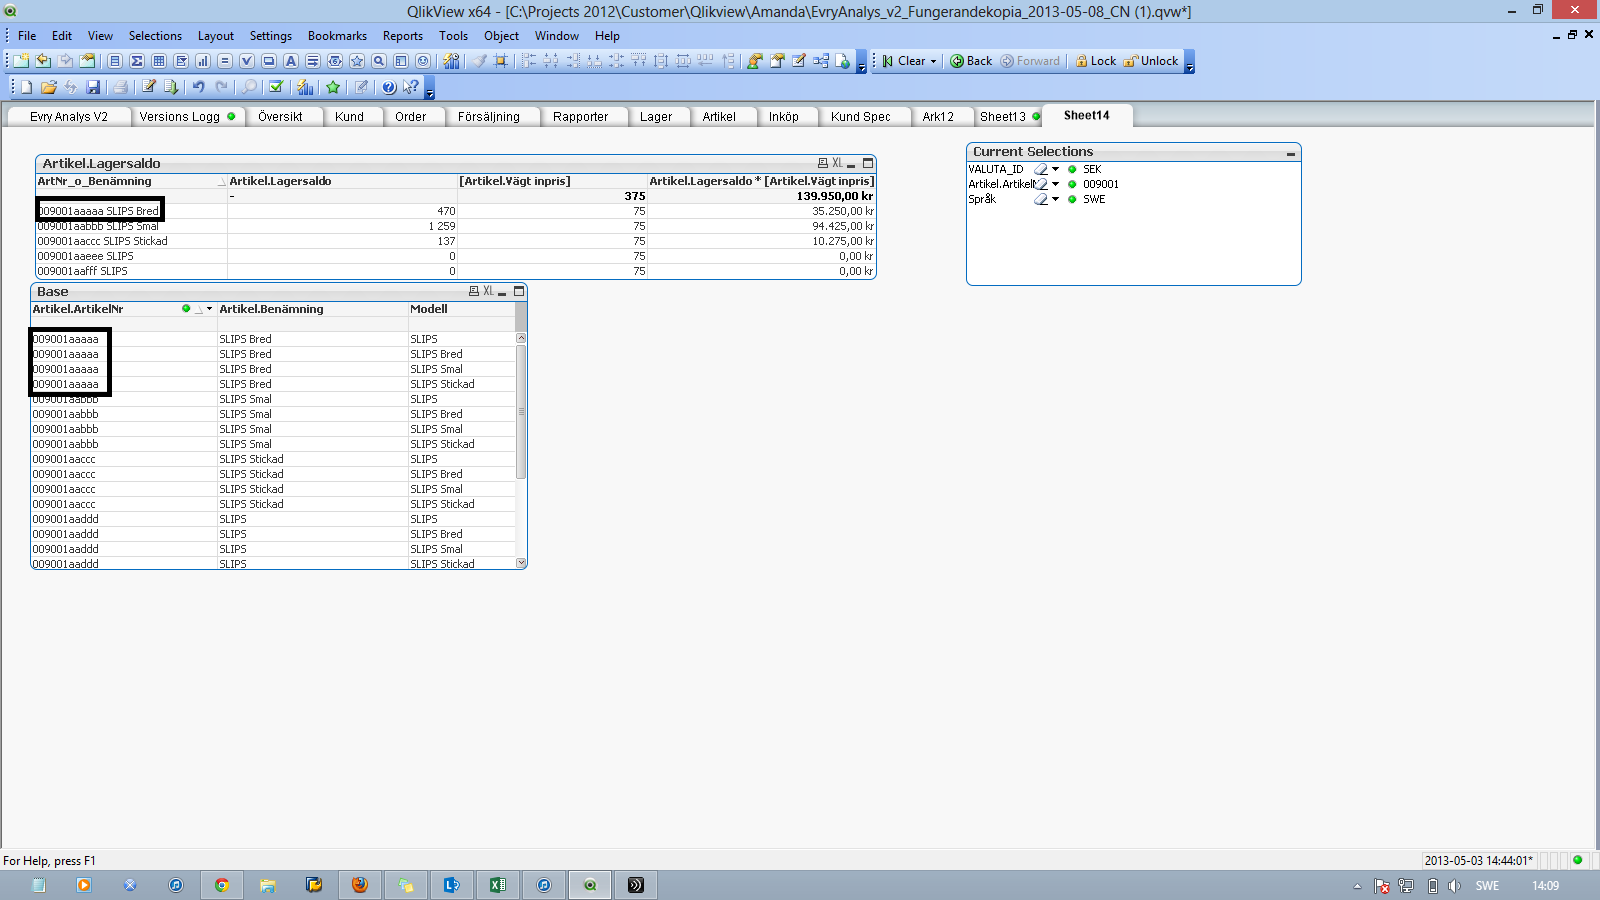
- Mark as New
- Bookmark
- Subscribe
- Mute
- Subscribe to RSS Feed
- Permalink
- Report Inappropriate Content
Try this:
Sum(
Aggr(
DISTINCT
Max(Artikel.Stocklevel) * Max(Artikel.Listprice)
,
Article.Artikelnr
)
)