Unlock a world of possibilities! Login now and discover the exclusive benefits awaiting you.
- Qlik Community
- :
- All Forums
- :
- QlikView App Dev
- :
- Re: Re: Edit the label of dimention
- Subscribe to RSS Feed
- Mark Topic as New
- Mark Topic as Read
- Float this Topic for Current User
- Bookmark
- Subscribe
- Mute
- Printer Friendly Page
- Mark as New
- Bookmark
- Subscribe
- Mute
- Subscribe to RSS Feed
- Permalink
- Report Inappropriate Content
Edit the label of dimention
Hi I have a chart shown as following, I would like to
1. change the dimention of grade from 'A.xpb' to 'A'. How could I do it either in script or directly in the chart?
2.I would like to label each grade in their area, such as lable 'E' in the green area.
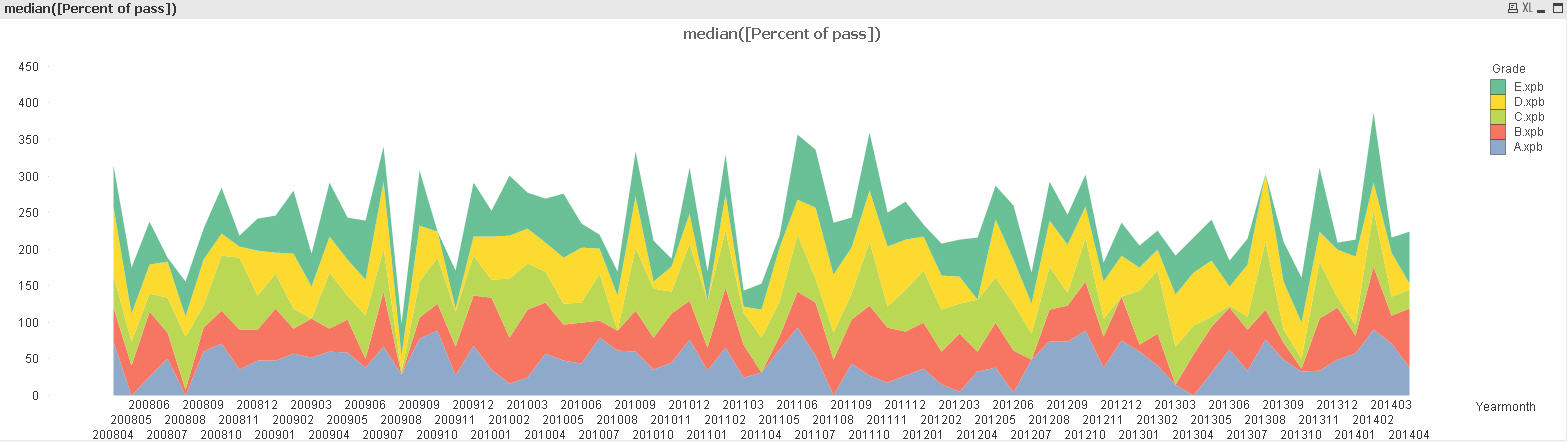
Thanks so much!
- « Previous Replies
-
- 1
- 2
- Next Replies »
- Mark as New
- Bookmark
- Subscribe
- Mute
- Subscribe to RSS Feed
- Permalink
- Report Inappropriate Content
It is not exactly what you expected, but see attached
Sergey
- Mark as New
- Bookmark
- Subscribe
- Mute
- Subscribe to RSS Feed
- Permalink
- Report Inappropriate Content
Hi Jelly,
1. You can write the expression like this either in script or in expression:
left(Grade,1) As Grade
2. For second problem I don't think that you can place legend over data points.
Hope this will help you..!
- Mark as New
- Bookmark
- Subscribe
- Mute
- Subscribe to RSS Feed
- Permalink
- Report Inappropriate Content
Hi,
For my second question, can I use the 'chart in text' in the presentation tab to add the text in each of the area?
I have tried that but I do not have a good modify on the Angle(Degrees)...
- Mark as New
- Bookmark
- Subscribe
- Mute
- Subscribe to RSS Feed
- Permalink
- Report Inappropriate Content
Hello Jelly,
For the 1st one u can edit the dimension of grade by left(Grade, 1) if u r sure about
that field will always contain grade at first place.
For the second one dere is no option to put labels on chart as this option is available in excel
but not in qlikview .
Well u can also grid chart if u want to display labels in chart
but frankly speaking till now i am unable to find out when grid chart is actually required
Regards,
Hassaan
- Mark as New
- Bookmark
- Subscribe
- Mute
- Subscribe to RSS Feed
- Permalink
- Report Inappropriate Content
you can actually achieve this with a combination of dual and an if statement...check this link out...i implemented into your file as an example (check attachment, modify to your need)
- « Previous Replies
-
- 1
- 2
- Next Replies »