Unlock a world of possibilities! Login now and discover the exclusive benefits awaiting you.
- Qlik Community
- :
- All Forums
- :
- QlikView App Dev
- :
- Re: Re: Expression Help
- Subscribe to RSS Feed
- Mark Topic as New
- Mark Topic as Read
- Float this Topic for Current User
- Bookmark
- Subscribe
- Mute
- Printer Friendly Page
- Mark as New
- Bookmark
- Subscribe
- Mute
- Subscribe to RSS Feed
- Permalink
- Report Inappropriate Content
Expression Help
Hello:
I am hoping to calculate a Volume Change metric as an expression. An abbreviate d version of my table structure is as follows:
Geography Time Period Target Volume
Boston QTD ONC 25
Boston QTD Other 27
Boston 1 Month ONC 10
Boston 1 Month Other 8
Boston 3 Months ONC 30
Boston 3 Months Other 25
New York QTD ONC 43
To achieve a total volume metric, my expression looks something like this:
=sum(Volume)
But now I want to do a Volume Change metric: (Current Time Period Volume - Prior Time Period Volume) / Prior Time Period Volume
How would I go about achieving such an expression with my current table setup??
I have a feeling that I would need to add another column for 'Previous Volume' but I do not really want to do this.
Any/all help is most appreciated.
Thank You!!
- Mark as New
- Bookmark
- Subscribe
- Mute
- Subscribe to RSS Feed
- Permalink
- Report Inappropriate Content
In your abbreviated data the only field that gives any time context is 'time period' but its bucketted into restricive / pre-aggregated values like QTD, 1 Month, 3 Month.
If you can access a more granular source of data that just has Dates in it , you can use many techniques in qlik to show any bucket of dates for period vs period comparison.
Do you have access to the raw values reported by date or date/time ?
- Mark as New
- Bookmark
- Subscribe
- Mute
- Subscribe to RSS Feed
- Permalink
- Report Inappropriate Content
Hi,
I have a straight table,in which we use expressions to show the "Profit" and other details for each product.
We calculate the "Profit" on the fly(depending on the selections).In the same table we have a "Range" column,which is calculated on the basis of "Profit". Now, I need another object to select the "Range".
| Product Name(Not Null) | Mfg Date(Not Null) | Profit | Range | Quantity |
|---|---|---|---|---|
| abc | 1/10/2014 | 70000 | 0-100000 | 4 |
| xyz | 1/10/2014 | 500000 | 400001-500000 | 5 |
| asdf | 1/10/2014 | 150000 | 100001-400000 | 6 |
To elaborate,the above table is my staright table.I have some predefined "Range",Like 0-100000,100001-400000 ,400001-500000 .Now I need another object(List Box or anything) of "Range" so that I can select the table depending on the range.
How to implement this logic?
- Mark as New
- Bookmark
- Subscribe
- Mute
- Subscribe to RSS Feed
- Permalink
- Report Inappropriate Content
I'm assuming you have more than those time periods in your system.
For example, if you have '1 Month' do you also have 'Last Month'?
If so:
Volume change = sum({$<[Time Period]={'1 Month'}>}Volume)- sum({$<[Time Period]={'Last Month'}>}Volume)
Or something along those lines since I can't see much from your post.
- Mark as New
- Bookmark
- Subscribe
- Mute
- Subscribe to RSS Feed
- Permalink
- Report Inappropriate Content
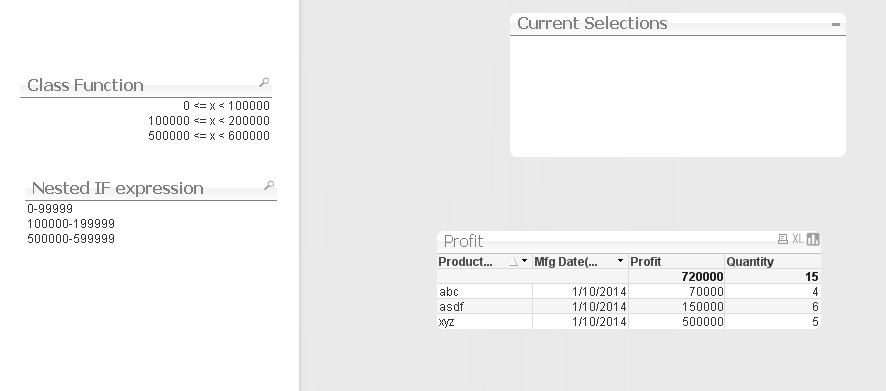
Here are 2 approaches to creating a list box to select range.
Both pre-aggregate the profits to the Product / Date combination granularity. So when you select a range it is going to show you product/date combinations that have that amount of profit.
The Class function is great for this because its 100% dynamic. However the bucket sizes/ranges are fixed. Below i set to 100000.
Nested If provides more customized bucket size but the expression is longer .
One issue is that both methods only bucket for the range that you have in the live data so you will notice missing buckets.
There is probably a not too difficult way of handling that if you expect gaps in your data / ranges .