Unlock a world of possibilities! Login now and discover the exclusive benefits awaiting you.
- Qlik Community
- :
- All Forums
- :
- QlikView App Dev
- :
- Filter distinct data (aggr, count, pivot)
- Subscribe to RSS Feed
- Mark Topic as New
- Mark Topic as Read
- Float this Topic for Current User
- Bookmark
- Subscribe
- Mute
- Printer Friendly Page
- Mark as New
- Bookmark
- Subscribe
- Mute
- Subscribe to RSS Feed
- Permalink
- Report Inappropriate Content
Filter distinct data (aggr, count, pivot)
Hi All,
I have country / customer / sku data and I need to build a tool to visually compare prices within the same country by customer (for non zero non missing items). Could you please help with the following illustrative scenario:
Input data:

Input data comes as a result of joining two tables: a table with country x customer x sku mapping + another table with price details.
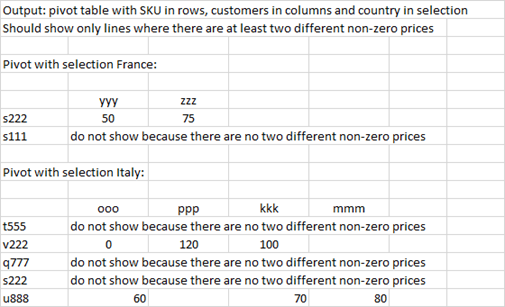
Required output: pivot table - for any selected countries - SKU in the rows / customers in the columns - show only lines where there are at least two DIFFERENT non-zero prices:
I've tried to achieve it with countr(aggr(distinct)), but struggling to make it work for all situations.

Please see enclosed the qvw - any suggestions much appreciated!
Thank you,
Regards
Accepted Solutions
- Mark as New
- Bookmark
- Subscribe
- Mute
- Subscribe to RSS Feed
- Permalink
- Report Inappropriate Content
Try this
Sum({<sku = {"=Count({<price -= {'0'}>}DISTINCT price) > 1"}>} price)
- Mark as New
- Bookmark
- Subscribe
- Mute
- Subscribe to RSS Feed
- Permalink
- Report Inappropriate Content
Try this
Sum({<sku = {"=Count({<price -= {'0'}>}DISTINCT price) > 1"}>} price)
- Mark as New
- Bookmark
- Subscribe
- Mute
- Subscribe to RSS Feed
- Permalink
- Report Inappropriate Content
Hi Sunny,
Thanks a lot stalwar1, your suggestion has solved it and I've applied the same approach to few other cases that I had, thanks.
Regards