Unlock a world of possibilities! Login now and discover the exclusive benefits awaiting you.
- Qlik Community
- :
- All Forums
- :
- QlikView App Dev
- :
- Full accumulation: having dimensions reflecting se...
- Subscribe to RSS Feed
- Mark Topic as New
- Mark Topic as Read
- Float this Topic for Current User
- Bookmark
- Subscribe
- Mute
- Printer Friendly Page
- Mark as New
- Bookmark
- Subscribe
- Mute
- Subscribe to RSS Feed
- Permalink
- Report Inappropriate Content
Full accumulation: having dimensions reflecting selection but expression that don't
Hi,
I want to show a graph/chart with a drill down from Year to month. Our year end starts june 1st.
periods 2015-05 to 2016-01 data is shown here:
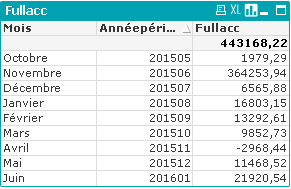
With one dimension, I get my full accumulation
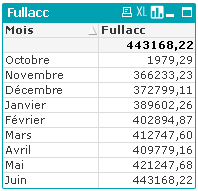
If I do a selection on the year 2016, I get only june but get 21 920.54$ instead of 443 168.22$.
I want a full accumulation so I do a set analysis to exclude the selection of the year. I get 443 168.22$ but all the months of 2015.
How do I get just june, 443 168.22$ ?
Accepted Solutions
- Mark as New
- Bookmark
- Subscribe
- Mute
- Subscribe to RSS Feed
- Permalink
- Report Inappropriate Content
Maybe like attached?
If you want to go for the dynamic approach using rangesum (which I like), you need to take care that your advanced aggegration dimension values are sorted chronological in load order. Either create your master calendar before loading the (potentially randomly ordered facts), or load a fix set of calendar data inline first in your script (a table you can drop after you've loaded all other data).
In my attached sample, I hope you get the principal approach. Instead of an inner aggregation sum(), a count() should work the same.
In a pivot or drill down as well as in total lines, using sum() for the outer aggregation will not return the correct value (which I assume is the latest value, or last line, but probably not the sum of fully aggregated rows).
So I used FirstSortedValue() as an outer aggregation function, so finally
=FirstSortedValue( aggr( rangesum(above(TOTAL sum({1} Value),0,rowno(total))), Year, Month), -Monthstart )
Please check if you can build a solution on this.
Regards,
Stefan
- Mark as New
- Bookmark
- Subscribe
- Mute
- Subscribe to RSS Feed
- Permalink
- Report Inappropriate Content
- Mark as New
- Bookmark
- Subscribe
- Mute
- Subscribe to RSS Feed
- Permalink
- Report Inappropriate Content
how are you identifying your full year ? only based on the Month Year ?
have you used total ?
like
sum (total <Month> value) ?
- Mark as New
- Bookmark
- Subscribe
- Mute
- Subscribe to RSS Feed
- Permalink
- Report Inappropriate Content
So sorry about that,
I do have a table with year, period, month and year-period to link to my amounts table through a year-period key.
So when I select a year, the link through year-period reduces only 201601.
Swuehl, rangesum with the aggr is the begining of what I'm trying to do.
I have a drill down graph, from year, to month. So my aggr should be on year and month, how does that count (turned to a sum) work then?
- Mark as New
- Bookmark
- Subscribe
- Mute
- Subscribe to RSS Feed
- Permalink
- Report Inappropriate Content
Maybe like attached?
If you want to go for the dynamic approach using rangesum (which I like), you need to take care that your advanced aggegration dimension values are sorted chronological in load order. Either create your master calendar before loading the (potentially randomly ordered facts), or load a fix set of calendar data inline first in your script (a table you can drop after you've loaded all other data).
In my attached sample, I hope you get the principal approach. Instead of an inner aggregation sum(), a count() should work the same.
In a pivot or drill down as well as in total lines, using sum() for the outer aggregation will not return the correct value (which I assume is the latest value, or last line, but probably not the sum of fully aggregated rows).
So I used FirstSortedValue() as an outer aggregation function, so finally
=FirstSortedValue( aggr( rangesum(above(TOTAL sum({1} Value),0,rowno(total))), Year, Month), -Monthstart )
Please check if you can build a solution on this.
Regards,
Stefan
- Mark as New
- Bookmark
- Subscribe
- Mute
- Subscribe to RSS Feed
- Permalink
- Report Inappropriate Content
Although I marked it as correct, my model is bit more convoluted, and I need to add dimensions to the AGGR function for it to work I think.
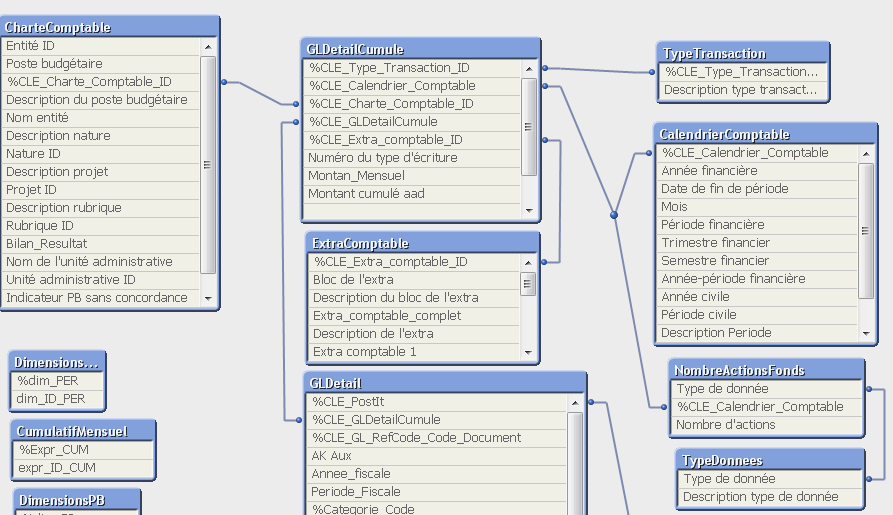
I do have a summarized table of transactions (GLdetailcumule), but it's granularity is a bit lower than year month. It goes down to year, month, than a line for each GL account with transactions (Key to "CharteComptable) and a line for each project number (Key to "ExtraComptable), and a line for each type of transaction (Journal entry, vs invoice, etc., Key to TypeTransaction). All of which can be selected in my front end.
So I need to figure out a way to have maybe a summarized table with only Year, Month, amount if that's what I want to show in the graph. But there would not be any reduction on selection of other dimensions (GL account, project number, etc.).
- Mark as New
- Bookmark
- Subscribe
- Mute
- Subscribe to RSS Feed
- Permalink
- Report Inappropriate Content
My other approach was to keep a Full Accumulation expression, but reduce my dimension to only months that exist in the selected year.
- Mark as New
- Bookmark
- Subscribe
- Mute
- Subscribe to RSS Feed
- Permalink
- Report Inappropriate Content
I think you don't need extra dimensions, but if you want to select e.g. project number and have that reflected in the inner aggregation, you need to replace the set identifier {1} with something that only clears selection in calendar fields.
In my application, maybe like
=FirstSortedValue( aggr( rangesum(above(TOTAL sum({$<Year=, Month=, Monthstart=>} Value),0,rowno(total))), Year, Month), -Monthstart )
- Mark as New
- Bookmark
- Subscribe
- Mute
- Subscribe to RSS Feed
- Permalink
- Report Inappropriate Content
I ended up using no drill down, and put Month&'-'&Year as the dimension, limit the dimension to 12, so that I have a rolling 12 month graph.