Unlock a world of possibilities! Login now and discover the exclusive benefits awaiting you.
- Qlik Community
- :
- All Forums
- :
- QlikView App Dev
- :
- Re: Hide and Show charts based on the straight tab...
- Subscribe to RSS Feed
- Mark Topic as New
- Mark Topic as Read
- Float this Topic for Current User
- Bookmark
- Subscribe
- Mute
- Printer Friendly Page
- Mark as New
- Bookmark
- Subscribe
- Mute
- Subscribe to RSS Feed
- Permalink
- Report Inappropriate Content
Hide and Show charts based on the straight table selections(tough scenario)
In my straight table 30 records are there like 1,2 3......30
If i select any record from 1 to 10 it should show bar chart
If i select any record from 11 to 20 it should show pie chart
If i select any record from 21 to 30 it should show line chart
Can Anyone tell me how can i acheive this.
- Mark as New
- Bookmark
- Subscribe
- Mute
- Subscribe to RSS Feed
- Permalink
- Report Inappropriate Content
Do you have a sample where we can play around with it? Solution may require some trial and error, it would be best if you can provide with a sample.
Best,
Sunny
- Mark as New
- Bookmark
- Subscribe
- Mute
- Subscribe to RSS Feed
- Permalink
- Report Inappropriate Content
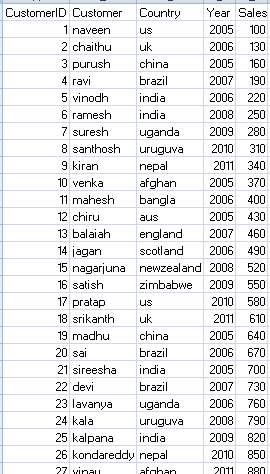
Above one is the sample data from that based on the customerid i want show and hide charts
- Mark as New
- Bookmark
- Subscribe
- Mute
- Subscribe to RSS Feed
- Permalink
- Report Inappropriate Content
That sad but as far as I know you can't change chart type by any expression.
So you need to create3 charts: bar, pie, line which will have same dimentions and expressions
and then on the layout tab write an expression (right there or have a variable with this) like
=if(getselectedcount(CustomerID) = 1 and CustomerID <= 10, 1, 0) -- any choosed from 1 to 10 included will show on first (let say bar) chart.
If you'd like, I can provide a sample app little bit later.