Unlock a world of possibilities! Login now and discover the exclusive benefits awaiting you.
- Qlik Community
- :
- All Forums
- :
- QlikView App Dev
- :
- How does one aggregate FirstSortedValue?
- Subscribe to RSS Feed
- Mark Topic as New
- Mark Topic as Read
- Float this Topic for Current User
- Bookmark
- Subscribe
- Mute
- Printer Friendly Page
- Mark as New
- Bookmark
- Subscribe
- Mute
- Subscribe to RSS Feed
- Permalink
- Report Inappropriate Content
How does one aggregate FirstSortedValue?
All,
I'm looking to calculate by department, the total number of people who have different numeric rankings, and I'm having difficulty in figuring out a solution.
Below is an example of the data:
| Department | Person | Team | SubGroup | SubGroupRank |
|---|---|---|---|---|
| D1 | P1 | T1 | SG1 | 1 |
| D1 | P1 | T1 | SG2 | 2 |
| D1 | P1 | T1 | SG3 | 3 |
| D1 | P1 | T2 | SG1 | 1 |
| D1 | P1 | T2 | SG2 | 2 |
| D1 | P2 | T2 | SG1 | 1 |
| D1 | P2 | T2 | SG2 | 2 |
| D2 | P3 | T3 | SG1 | 1 |
| D2 | P3 | T3 | SG2 | 2 |
| D2 | P3 | T3 | SG4 | 4 |
The data is related in this way:
The department and person has a 1:1 relationship.
A person can be related to multiple teams.
A team can have multiple subgroups.
If a person is a member of a team, then they inherit all subgroups belonging to that team.
Each subgroup has a specific ranking / importance level.
I assigned a numeric ranking system to each distinct subgroup.
Originally I had 4 tables loaded that were joined by a key field in each. Then I decided I would load the 4 tables with joins in the script to create one large flat table, as I thought that perhaps it might make sense to flag each row as to whether or not it contains a max value and what that max value is. I haven't figured out how to accomplish creating those two additional fields, if that is even the right way to go with this.
Within my applicationI was able to create a pivot table chart that uses the following dimensions and expressions:
DIMENSION = Department, Person
EXPRESSION = FirstSortedValue(DISTINCT SubGroup, SubGroupRank)
That resulted in a detailed breakdown by Department of each user and what their max rank was. I can't figure out how to aggregate it into a department only view.
What I am seeking to solve for is the following:
What is the total count of max rank for each person, by department?
An example of the desired output is as follows:
| Department | SubGroup Rank 1 | SubGroup Rank 2 | SubGroup Rank 3 | SubGroup Rank 4 |
|---|---|---|---|---|
| D1 | 0 | 1 | 1 | 0 |
| D2 | 0 | 0 | 0 | 1 |
Or:
| Deparment | SubGroup | SubGroup | SubGroup | SubGroup |
|---|---|---|---|---|
| 1 | 2 | 3 | 4 | |
| D1 | 0 | 1 | 1 | 0 |
| D2 | 0 | 0 | 0 | 1 |
Either of the above provides the answers I am looking for.
Here is an explanation of what the above charts show:
Departments D1 and D2 have 0 people who have a max SubGroupRank of 1.
Department D1 has 1 person (person P2) who has a max SubGroupRank of 2. Department D2 has 0 people.
Department D1 has 1 person (person P1) who has a max SubGroupRank of 3. Department D2 has 0 people.
Department D2 has 1 person (person P3) who has a max SubGroupRank of 4. Department D1 has 0 people.
Any help is much appreciated! Thanks!
- Mark as New
- Bookmark
- Subscribe
- Mute
- Subscribe to RSS Feed
- Permalink
- Report Inappropriate Content
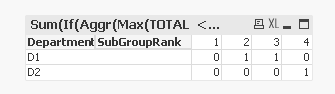
May be this:
Sum(If(Aggr(Max(TOTAL <Person> Aggr(FirstSortedValue(DISTINCT SubGroupRank, -SubGroupRank), Department, Person)), Department, Person, SubGroupRank) = Aggr(FirstSortedValue(DISTINCT SubGroupRank, -SubGroupRank), Department, Person, SubGroupRank), 1))
- Mark as New
- Bookmark
- Subscribe
- Mute
- Subscribe to RSS Feed
- Permalink
- Report Inappropriate Content
Maybe something like this:
Create two dimensions (2nd is a calculated dimension):
1) Department
2) =Aggr( Max(SubGroupRank), Department, Person)
and one expression:
=Count(DISTINCT Person)
- Mark as New
- Bookmark
- Subscribe
- Mute
- Subscribe to RSS Feed
- Permalink
- Report Inappropriate Content
Add a flag field to the table in the script:
LOAD
Department,
Person,
Max(SubGroupRank) as SubGroupRank,
1 as Flag
Resident
T1
Group By
Department,
Person
;
Then create a pivot table and use Department and SubGroup as dimensions and =Count({<Flag={1}>}distinct Person)+sum({1}0) as expression and disable the Suppress Zero-values option of the pivot table.
talk is cheap, supply exceeds demand