Unlock a world of possibilities! Login now and discover the exclusive benefits awaiting you.
- Qlik Community
- :
- All Forums
- :
- QlikView App Dev
- :
- How to create a median of percentage of completed ...
- Subscribe to RSS Feed
- Mark Topic as New
- Mark Topic as Read
- Float this Topic for Current User
- Bookmark
- Subscribe
- Mute
- Printer Friendly Page
- Mark as New
- Bookmark
- Subscribe
- Mute
- Subscribe to RSS Feed
- Permalink
- Report Inappropriate Content
How to create a median of percentage of completed help desk tickets
All,
Attached is a sample Qlikview document showing a group of helpdesk tickets, the ID's associated with them, the month/year submitted, and the time to resolve. The issue is in trying to create a median of the SLOWEST 30% of just the completed tickets. The actual "median" function will not work in this scenario due to a need for aggregation.
Example:
| Month-Yr | ID | Time | Status |
| Dec-2014 | 1 | 25 | Completed |
| Dec-2014 | 2 | 24 | Completed |
| Dec-2014 | 3 | 20 | Completed |
| Dec-2014 | 4 | 17 | Completed |
| Dec-2014 | 5 | 10 | Not Resolved |
| Dec-2014 | 6 | 8 | Completed |
| Dec-2014 | 8 | 5 | Not Resolved |
| Dec-2014 | 7 | 5 | Completed |
| Dec-2014 | 9 | 3 | Completed |
| Dec-2014 | 10 | 2 | Completed and so on..... |
For a month where there are 70 tickets, 60 of them were resolved, 30% is 18 tickets. The requirement is to find the median of those 18 tickets.
I have been unable to create the final calculation for the median due to the restriction of only using a dynamic 30% set for each month.
In the real application, set analysis on 3 fields is needed for all calculations to force the "completed' and 2 other filters at all times. Even without those, this is a difficult expression. Adding a < or > to compare a value for <30% or >30% fails in every scenario tried so far.
I have had some good suggestions for finding the fastest or overall median that have worked well, but the slowest one has me stumped.
Any ideas?
Very much appreciate any suggestions! !
Accepted Solutions
- Mark as New
- Bookmark
- Subscribe
- Mute
- Subscribe to RSS Feed
- Permalink
- Report Inappropriate Content
The following ought to work for the slowest tickets (and for the fastest you just replace <=0.3 with >=0.7):
=Median({...}
Aggr(
If(Rank(Only({...} TimeSpent),4,1)/Count({...} total <[Month-Yr]> ID)<=0.3, TimeSpent ),
[Month-Yr],ID
)
)
where you need to replace all three Set Analysis expressions with {$<Status={Completed}>}
HIC
- Mark as New
- Bookmark
- Subscribe
- Mute
- Subscribe to RSS Feed
- Permalink
- Report Inappropriate Content
I kind of wonder about the metric, but here's a try:
median({<Status={Completed}>}
if(TimeSpent<=aggr(NODISTINCT Fractile({<Status={Completed}>}TimeSpent, .3), [Month-Yr])
,TimeSpent))
It doesn't sample the bottom 30% of tickets, but rather those tickets that are <= 30th percentile for TimeSpent.
-Rob
- Mark as New
- Bookmark
- Subscribe
- Mute
- Subscribe to RSS Feed
- Permalink
- Report Inappropriate Content
Open a new script and enter:
ExampleData:
Load
*
Inline
[
TicketID, Period,TimeToComplete
1,1,12
2,1,4
3,1,8
4,1,15
5,1,5
6,1,2
7,2,9
8,2,14
9,2,1
10,2,16
];
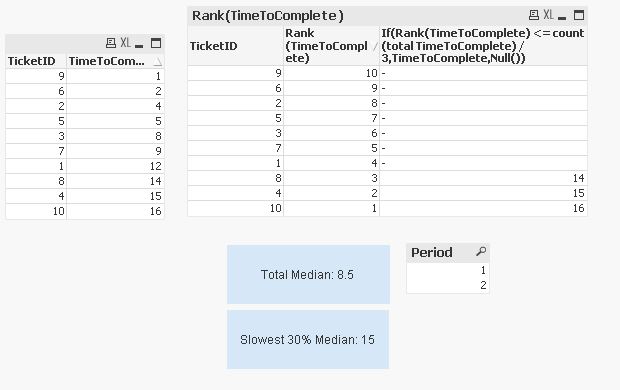
Textbox for median:
='Total Median: ' & Median(TimeToComplete)
Textbox for bottom 30% median:
='Slowest 30% Median: ' & median(if(aggr(rank(max(TimeToComplete)),TicketID)<= count (total TimeToComplete) / 3,TimeToComplete))
This solution ranks the values using aggr, but keeps only those where the rank is in the top third (or, more specifically, those where the rank is less than the total N / 3).
So in this example, bottom third contains 14, 15, and 16. The median of these three values is 15.
You can combine with set analysis to include only the completed tickets.
I'm sorry that I cannot see your file, but I only have access to the personal edition right now. I apologize if I'm missing anything.
- Mark as New
- Bookmark
- Subscribe
- Mute
- Subscribe to RSS Feed
- Permalink
- Report Inappropriate Content
Rob,
Thank you so much for replying. It's very close, but I think perhaps I wasn't clear that I needed the slowest times, which would be the largest time spent. Here's an version of my chart with the medians I need to see:
| Month-Yr | # Tickets | List of Times | # of Tickets making 30% | Median of 30% Slowest (greatest times) |
| Dec-2014 | 8 | 2,3,5,8,17,20,24,25 | 2.4 (round to 2) | 24.5 |
| Feb-2015 | 15 | 1,1,1,2,2,2,3,3,3,4,4,6,9,15,40 | 5 | 9 |
| Jan-2015 | 8 | 14,15,18,18,20,25,40,80 | 2.4 (round to 2) | 60 |
I tried using the reverse of your expression, replacing .3 with .7 and got very close, but it's off by 1 position. For Dec, I got 24, for Feb, I got 7.5 (avg of 6 & 9)
How could I tweak this to get the correct position/number?
Thanks!
- Mark as New
- Bookmark
- Subscribe
- Mute
- Subscribe to RSS Feed
- Permalink
- Report Inappropriate Content
I like LastGoodUserNam answer. I think that gives you what you want.
-Rob
- Mark as New
- Bookmark
- Subscribe
- Mute
- Subscribe to RSS Feed
- Permalink
- Report Inappropriate Content
Thank you for responding, LastGoodUserNam. I'm sorry, but this doesn't work for data where the medians must be aggregated by date. Here are the results using the real data with your expression:
| Month-Yr | # Tickets | 30% of Tickets | List of times | Median using your expression | Median needed |
| Dec-2014 | 8 | 2 | 2,3,5,8,17,20,24,25 | 24 | 24.5 |
| Feb-2015 | 15 | 5 | 1,1,1,2,2,2,3,3,3,4,4,6,9,15,40 | 40 | 9 |
| Jan-2015 | 8 | 2 | 14,15,18,18,20,25,40,80 | 22.5 | 60 |
The median must take all of the times, rank them for the specific month, calculate how many tickets make 30% of the completed tickets and then find the median of those tickets for that month.
Still looking for a solution. 
- Mark as New
- Bookmark
- Subscribe
- Mute
- Subscribe to RSS Feed
- Permalink
- Report Inappropriate Content
The following ought to work for the slowest tickets (and for the fastest you just replace <=0.3 with >=0.7):
=Median({...}
Aggr(
If(Rank(Only({...} TimeSpent),4,1)/Count({...} total <[Month-Yr]> ID)<=0.3, TimeSpent ),
[Month-Yr],ID
)
)
where you need to replace all three Set Analysis expressions with {$<Status={Completed}>}
HIC
- Mark as New
- Bookmark
- Subscribe
- Mute
- Subscribe to RSS Feed
- Permalink
- Report Inappropriate Content
Henric,
Thank you! This creates the slowest median of the completed tickets as was needed.
Mari