Unlock a world of possibilities! Login now and discover the exclusive benefits awaiting you.
- Qlik Community
- :
- All Forums
- :
- QlikView App Dev
- :
- Re: How to label X axis at 2 min interval
- Subscribe to RSS Feed
- Mark Topic as New
- Mark Topic as Read
- Float this Topic for Current User
- Bookmark
- Subscribe
- Mute
- Printer Friendly Page
- Mark as New
- Bookmark
- Subscribe
- Mute
- Subscribe to RSS Feed
- Permalink
- Report Inappropriate Content
How to label X axis at 2 min interval
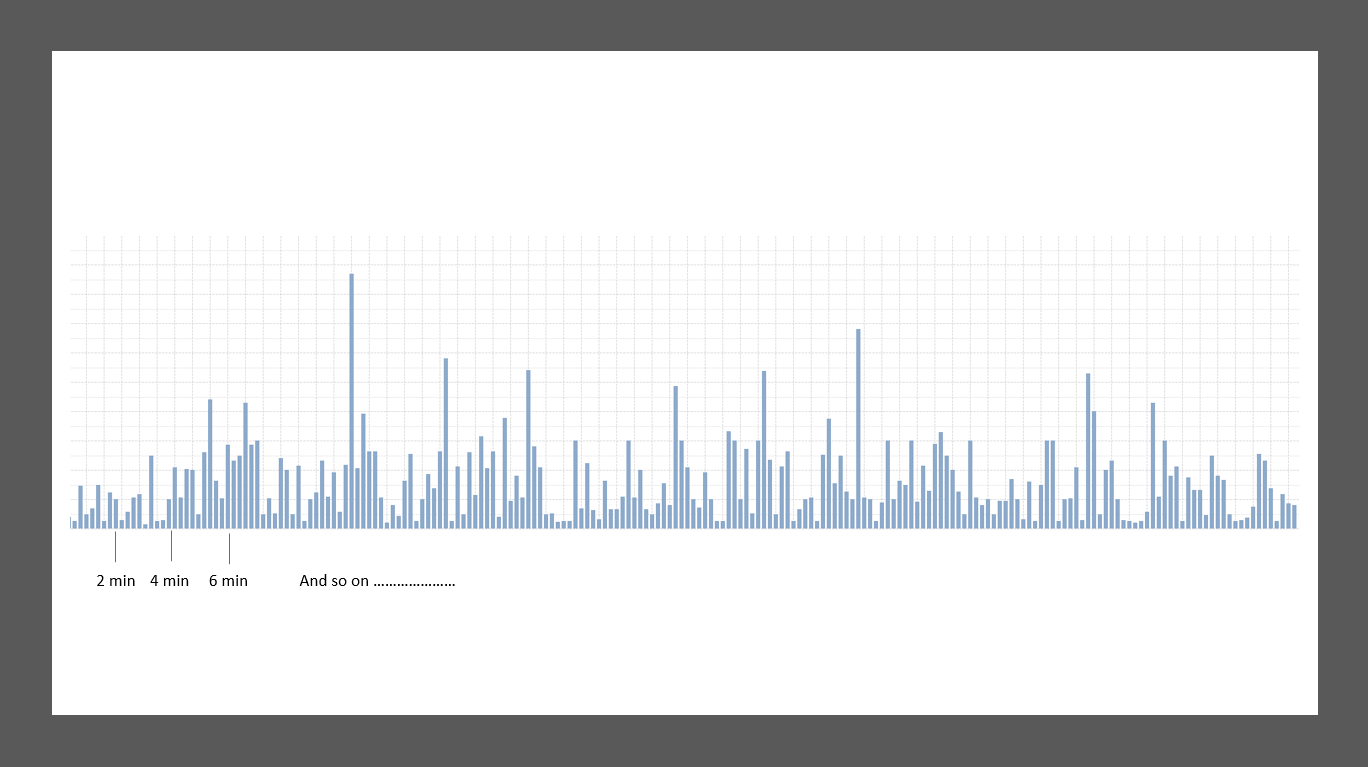
I have a bar chart where my min and max x axis values are 7 am to 7 pm. the data behind is at seconds granular level. there is a transaction happening at each second. I dont want to show each second timestamp for my dimension label. instead, I want the dim label to appear as shown below>>>>>>>>> at 2 min intervals; the transaction date field (which is the dim in below chart) is in a format- '6/20/2017 7:01:35 AM' format. how do i achieve the result so my boss will be happy 
- Mark as New
- Bookmark
- Subscribe
- Mute
- Subscribe to RSS Feed
- Permalink
- Report Inappropriate Content
Hi,
Check this post and take some idea.
Regards,
Kaushik Solanki
- Mark as New
- Bookmark
- Subscribe
- Mute
- Subscribe to RSS Feed
- Permalink
- Report Inappropriate Content
Hi, I think you can manage it with as text color :
=if(match(mid(Timestamp,13,2),'00','02','04','06','08','10','12','14','16','18','20','22','24','26','28','30', '32','34', '36','38', '40','42', '44','46', '48','50', '52','54',
'56','58')>0,Black(),White())
I have tried and it works for dimension in straight chart but don't works in a bar chart. I don't understand why.
- Mark as New
- Bookmark
- Subscribe
- Mute
- Subscribe to RSS Feed
- Permalink
- Report Inappropriate Content
hi Jean-Baptiste Thanks for your help but that did not work for me.