Unlock a world of possibilities! Login now and discover the exclusive benefits awaiting you.
- Qlik Community
- :
- All Forums
- :
- QlikView App Dev
- :
- Re: How to recalculate expression based on individ...
- Subscribe to RSS Feed
- Mark Topic as New
- Mark Topic as Read
- Float this Topic for Current User
- Bookmark
- Subscribe
- Mute
- Printer Friendly Page
- Mark as New
- Bookmark
- Subscribe
- Mute
- Subscribe to RSS Feed
- Permalink
- Report Inappropriate Content
How to recalculate expression based on individual values in a table that displays sum
I have a problem where I want to show the "Price Index" in a row of a table for a dimension that shows sums for other expressions.
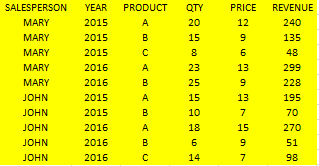
I have a data source like this:
I would like to create a report basically like this - but I cannot figure out how to complete the last column, 'Price Index'
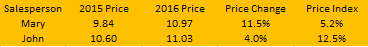
In excel I can demonstrate how the Price Index is calculated. It is basically a weighted average of the price increases, with the weighting being the 2016 revenue. The entire set of data gives a price index of 11.6%, the Price Index for each salesperson is shown above in the sample report: 5.2% and 12.5%
However the rows in the report are sum functions, with the sum of quantity and sum of revenue (both hidden) and divided by each other to get a price for both 2015 and 2016. The price index requires discrete values to be compared to each other and then added together etc to finally get the result. How can something like this be put into a report column?
Below is a how the price index is calculated:
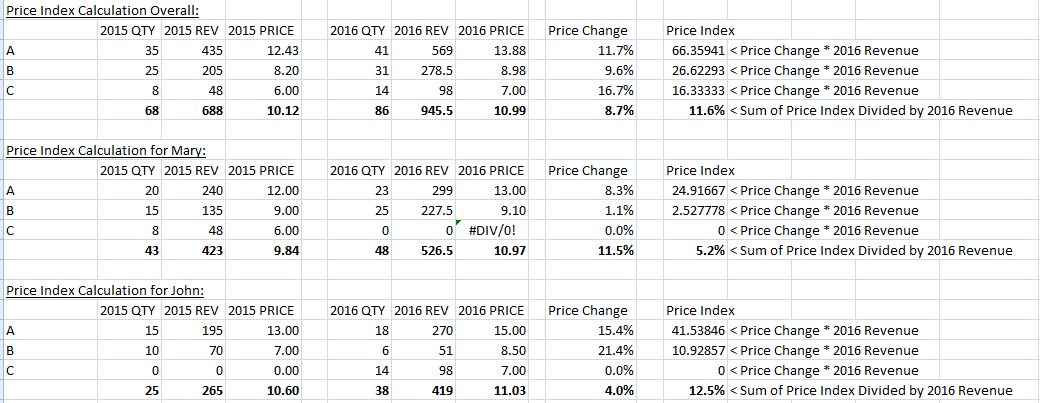
Is this possible?
Thank you
- « Previous Replies
-
- 1
- 2
- Next Replies »
Accepted Solutions
- Mark as New
- Bookmark
- Subscribe
- Mute
- Subscribe to RSS Feed
- Permalink
- Report Inappropriate Content
Something like this?
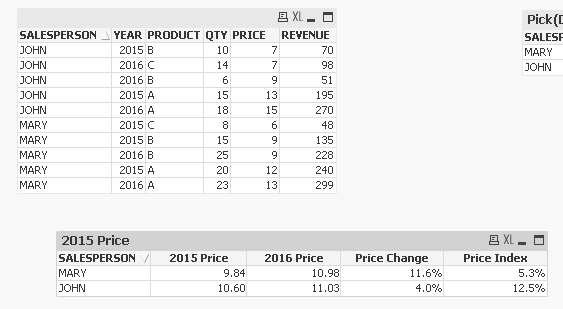
I created a straight table with 4 expressions
1) =SUM({<YEAR = {$(=Max(YEAR) - 1)}>}REVENUE)/Sum({<YEAR = {$(=Max(YEAR) - 1)}>}QTY)
2) =SUM({<YEAR = {$(=Max(YEAR))}>}REVENUE)/Sum({<YEAR = {$(=Max(YEAR))}>}QTY)
3) =Column(2)/Column(1) - 1
4) =Sum(Aggr((((SUM({<YEAR = {$(=Max(YEAR))}>}REVENUE)/Sum({<YEAR = {$(=Max(YEAR))}>}QTY))/(Sum({<YEAR = {$(=Max(YEAR) - 1)}>}REVENUE)/Sum({<YEAR = {$(=Max(YEAR) - 1)}>}QTY))) -1) * SUM({<YEAR = {$(=Max(YEAR))}>}REVENUE), PRODUCT, SALESPERSON))/SUM({<YEAR = {$(=Max(YEAR))}>}REVENUE)
This right now will work with comparison of 2 years. Is this always going to be a 2 year comparison or could there be a comparison of more than 2 years?
I also tried a version where you can do this in Pivot Table, but was only able to get Price Change (Got too lazy to fix the Price Index). If you like the Pivot Table version, I can get that working too 
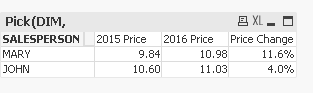
Dimension
1) SALESPERSON
2) =Pick(DIM, YEAR & ' Price', 'Price Change', 'Price Index')
Expression
Pick(DIM,
Num(Sum(REVENUE)/Sum(QTY), '#,##0.00'),
Num((Sum(TOTAL <SALESPERSON> {<YEAR = {$(=Max(YEAR))}>}REVENUE)/Sum(TOTAL <SALESPERSON> {<YEAR = {$(=Max(YEAR))}>}QTY))/(Sum(TOTAL <SALESPERSON> {<YEAR = {$(=Max(YEAR)-1)}>}REVENUE)/Sum(TOTAL <SALESPERSON> {<YEAR = {$(=Max(YEAR)-1)}>}QTY)) - 1, '##.0%'))
- Mark as New
- Bookmark
- Subscribe
- Mute
- Subscribe to RSS Feed
- Permalink
- Report Inappropriate Content
Could you upload an excel file with your sample data?
- Mark as New
- Bookmark
- Subscribe
- Mute
- Subscribe to RSS Feed
- Permalink
- Report Inappropriate Content
Something like this?
I created a straight table with 4 expressions
1) =SUM({<YEAR = {$(=Max(YEAR) - 1)}>}REVENUE)/Sum({<YEAR = {$(=Max(YEAR) - 1)}>}QTY)
2) =SUM({<YEAR = {$(=Max(YEAR))}>}REVENUE)/Sum({<YEAR = {$(=Max(YEAR))}>}QTY)
3) =Column(2)/Column(1) - 1
4) =Sum(Aggr((((SUM({<YEAR = {$(=Max(YEAR))}>}REVENUE)/Sum({<YEAR = {$(=Max(YEAR))}>}QTY))/(Sum({<YEAR = {$(=Max(YEAR) - 1)}>}REVENUE)/Sum({<YEAR = {$(=Max(YEAR) - 1)}>}QTY))) -1) * SUM({<YEAR = {$(=Max(YEAR))}>}REVENUE), PRODUCT, SALESPERSON))/SUM({<YEAR = {$(=Max(YEAR))}>}REVENUE)
This right now will work with comparison of 2 years. Is this always going to be a 2 year comparison or could there be a comparison of more than 2 years?
I also tried a version where you can do this in Pivot Table, but was only able to get Price Change (Got too lazy to fix the Price Index). If you like the Pivot Table version, I can get that working too
Dimension
1) SALESPERSON
2) =Pick(DIM, YEAR & ' Price', 'Price Change', 'Price Index')
Expression
Pick(DIM,
Num(Sum(REVENUE)/Sum(QTY), '#,##0.00'),
Num((Sum(TOTAL <SALESPERSON> {<YEAR = {$(=Max(YEAR))}>}REVENUE)/Sum(TOTAL <SALESPERSON> {<YEAR = {$(=Max(YEAR))}>}QTY))/(Sum(TOTAL <SALESPERSON> {<YEAR = {$(=Max(YEAR)-1)}>}REVENUE)/Sum(TOTAL <SALESPERSON> {<YEAR = {$(=Max(YEAR)-1)}>}QTY)) - 1, '##.0%'))
- Mark as New
- Bookmark
- Subscribe
- Mute
- Subscribe to RSS Feed
- Permalink
- Report Inappropriate Content
Wow, this is brilliant!
Thank you.
The aggr function seems very powerful.
Yes the comparison will always be over two years, however I can see where it would be interesting to compare current values to a point in time n years ago. I am assuming in a case like this one would just change (YEAR)-1 to (YEAR)-n in the set analysis portion of your statement?
I am going to now try and recreate this in my application with large sets of data - it seems to me at first glance it should work based on your use of SALESPERSON, PRODUCT in the set analysis part.
I do not typically use pivot tables, but that may be an interesting solution as well since I often have users who prefer this format in excel files.
- Mark as New
- Bookmark
- Subscribe
- Mute
- Subscribe to RSS Feed
- Permalink
- Report Inappropriate Content
I have a followup question - i am testing with my real data and have come across a situation where the solution needs to be modified slightly:
How to change the expression below so that instances where the quantity or revenue in either 2016 or 2015 are negative are excluded from the price index calculation.
I have been trying to put a statement like
if(sum({$<YEAR={$(=max(YEAR))}, PRODUCT, SALESPERSON=>}QTY)>0, <do the calculation>)
but with no luck, i can't seem to figure out how to incorporate this or where to put it.
If i can get that working, i can then try and make it into an IF statement using AND to combine the 4 scenarios - check for negative QTY in 2016, negative QTY in 2015, negative REVENUE in 2016 and negative REVENUE in 2015
=Sum(Aggr((((SUM({<YEAR = {$(=Max(YEAR))}>}REVENUE)/Sum({<YEAR = {$(=Max(YEAR))}>}QTY))/(Sum({<YEAR = {$(=Max(YEAR) - 1)}>}REVENUE)/Sum({<YEAR = {$(=Max(YEAR) - 1)}>}QTY))) -1) * SUM({<YEAR = {$(=Max(YEAR))}>}REVENUE), PRODUCT, SALESPERSON))/SUM({<YEAR = {$(=Max(YEAR))}>}REVENUE)
- Mark as New
- Bookmark
- Subscribe
- Mute
- Subscribe to RSS Feed
- Permalink
- Report Inappropriate Content
Price index calculation only? You want it to be included in the other three expressions?
- Mark as New
- Bookmark
- Subscribe
- Mute
- Subscribe to RSS Feed
- Permalink
- Report Inappropriate Content
Yes, just the price index.
These negatives usually have little impact in the overall average price and are often legitimate - for example a credit issued to a customer.
However in the calculation for price index they can have a massive impact that is not truly reflecting reality, so it makes sense to remove these from the calculation
- Mark as New
- Bookmark
- Subscribe
- Mute
- Subscribe to RSS Feed
- Permalink
- Report Inappropriate Content
May be this?
=Sum(Aggr((((SUM({<YEAR = {$(=Max(YEAR))}>}If(PRICE > 0 and QTY > 0, REVENUE))/Sum({<YEAR = {$(=Max(YEAR))}>}If(PRICE > 0 and QTY > 0, QTY)))/(Sum({<YEAR = {$(=Max(YEAR) - 1)}>}If(PRICE > 0 and QTY > 0, REVENUE))/Sum({<YEAR = {$(=Max(YEAR) - 1)}>}If(PRICE > 0 and QTY > 0, QTY)))) -1) * SUM({<YEAR = {$(=Max(YEAR))}>}If(PRICE > 0 and QTY > 0, REVENUE)), PRODUCT, SALESPERSON))/SUM({<YEAR = {$(=Max(YEAR))}>}If(PRICE > 0 and QTY > 0, REVENUE))
- Mark as New
- Bookmark
- Subscribe
- Mute
- Subscribe to RSS Feed
- Permalink
- Report Inappropriate Content
Hi Sunny
Let me try it and post back, i will be offline for a couple days so unfortunately have to delay my response.
Thanks again for your help on this.
- Mark as New
- Bookmark
- Subscribe
- Mute
- Subscribe to RSS Feed
- Permalink
- Report Inappropriate Content
Sure thing, take your time
- « Previous Replies
-
- 1
- 2
- Next Replies »