Unlock a world of possibilities! Login now and discover the exclusive benefits awaiting you.
- Qlik Community
- :
- All Forums
- :
- QlikView App Dev
- :
- Less/greater than a variable data
- Subscribe to RSS Feed
- Mark Topic as New
- Mark Topic as Read
- Float this Topic for Current User
- Bookmark
- Subscribe
- Mute
- Printer Friendly Page
- Mark as New
- Bookmark
- Subscribe
- Mute
- Subscribe to RSS Feed
- Permalink
- Report Inappropriate Content
Less/greater than a variable data
Hi everyone,
I would like to compare in set analysis a "DateField" with a variable MonthYear.
e.g. I can calculate the last 12 month value for every month (in Aug15 I display the sum of value from Aug15 to Sep14) with also an if condition. But I would like to insert another condition linked with a "DateField" great/less than a MonthYear and I can't do that.
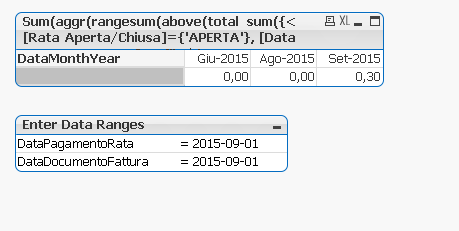
Here the "wrong" example of my expression, in this case I'm trying to explain what I'm looking for in Aug15:
Sum(aggr(rangesum(above(total sum({<[Rata Aperta/Chiusa]={'APERTA'} , datamonthyear([Data Pagamento Rata])={">Aug15"},
datamonthyear([Data Documento Fattura])={"<Sep15"}>} ([Importo Rata Corretto]*([Importo Carico]/[Importo EM TOT NO IVA_Corretto])/1000000)),0,12)),
DataMonthYear))
I would like that the expression works for every MonthYear.
Hope it's clear enough.
I attach here my qvw.
Thx so much
- « Previous Replies
-
- 1
- 2
- Next Replies »
- Mark as New
- Bookmark
- Subscribe
- Mute
- Subscribe to RSS Feed
- Permalink
- Report Inappropriate Content
Something like this:

- Mark as New
- Bookmark
- Subscribe
- Mute
- Subscribe to RSS Feed
- Permalink
- Report Inappropriate Content
Thanks Sinan,
but is not exactly what I'm looking for.
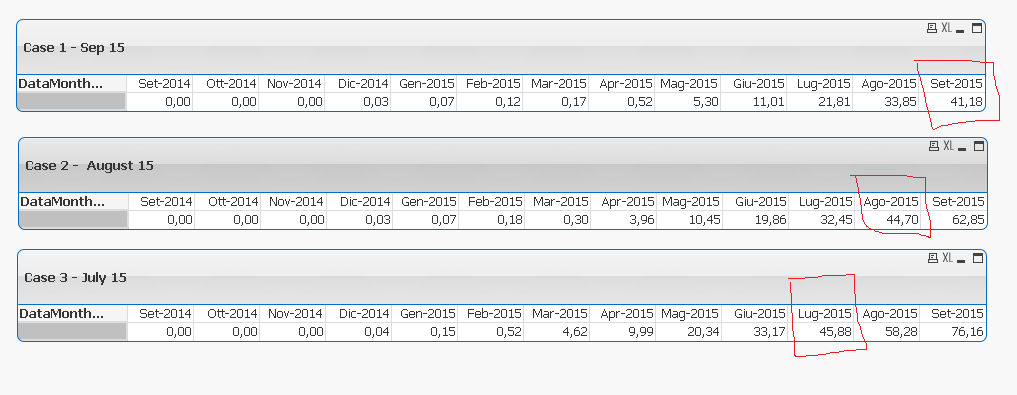
Your solution is about a static case, August 15, where [Data Pagamento Rata] must be greater than 2015-09-01 and [Data Documento Fattura] must be less than 2015-09-01.
But in the case of July 15, [Data Pagamento Rata] must be greater than 2015-08-01 and [Data Documento Fattura] must be less than 2015-08-01.
So what we need in the set analysis is to create a variable date and insert it. No fixed date like 2015-08-01, but something that works with a condition.
Is a bit clearer now?
sunindia have u ever implemented something like that?
- Mark as New
- Bookmark
- Subscribe
- Mute
- Subscribe to RSS Feed
- Permalink
- Report Inappropriate Content
I added two variables via an input box:
- Mark as New
- Bookmark
- Subscribe
- Mute
- Subscribe to RSS Feed
- Permalink
- Report Inappropriate Content
This is not what i'm looking for.
Maybe i'm not good about explaining my problem.
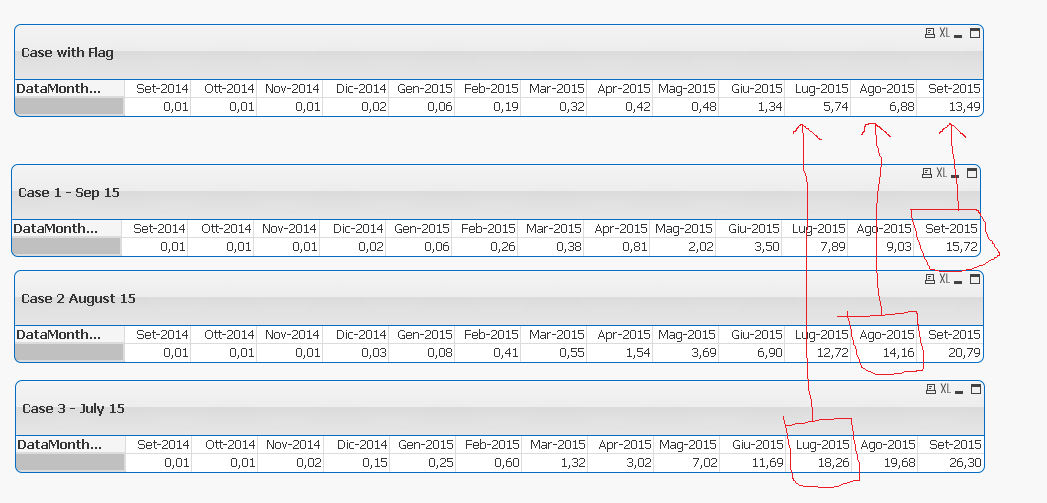
In the red square there are the right value that i would like to see in the same table. The issue is to create a variable date that changes for every DataMonthYear.
Here my qvw.
gwassenaar have u ever seen something like that?
- Mark as New
- Bookmark
- Subscribe
- Mute
- Subscribe to RSS Feed
- Permalink
- Report Inappropriate Content
The set in a set analysis expression is calculated at the chart level, not at the row level. That's why what you're trying isn't working.
Perhaps you can calculate it in the script in a preceding load since all the fields you need seem to be part of the Facts table:
Facts:
LOAD *, If( [Data Documento Fattura] > MonthEnd(Data)-1 and [Data Pagamento Rata] <= MonthEnd(Data) ,1,0) As Flag;
LOAD
"REP_ID" as [ID Negozio],
text("ART_ID") as [ID Articolo],
....etc...
talk is cheap, supply exceeds demand
- Mark as New
- Bookmark
- Subscribe
- Mute
- Subscribe to RSS Feed
- Permalink
- Report Inappropriate Content
Thanks gwassenaar for your help, but I haven't got it yet.
How should I insert "Flag" in the formula of chart?
- Mark as New
- Bookmark
- Subscribe
- Mute
- Subscribe to RSS Feed
- Permalink
- Report Inappropriate Content
Use this set selector {<Flag={1}>}
talk is cheap, supply exceeds demand
- Mark as New
- Bookmark
- Subscribe
- Mute
- Subscribe to RSS Feed
- Permalink
- Report Inappropriate Content
I tried, but it doesn't work yet. Maybe I'm wrong with my formula:
Sum(aggr(rangesum(above(total sum({<[Rata Aperta/Chiusa]={'APERTA'}>}
([Importo Rata Corretto]*([Importo Carico]/[Importo EM TOT NO IVA_Corretto])/1000000)),0,12)),DataMonthYear))
+
Sum(aggr(rangesum(above(total sum({<[Rata Aperta/Chiusa]={'CHIUSA'}, Flag={1} >}
([Importo Rata Corretto]*([Importo Carico]/[Importo EM TOT NO IVA_Corretto])/1000000)),0,12)),DataMonthYear))
That's what I would like to display:
Here the new qvw with the script:
LOAD *, If( [Data Documento Fattura] > MonthEnd(Data)-1 and [Data Pagamento Rata] <= MonthEnd(Data) ,1,0) As Flag;
- Mark as New
- Bookmark
- Subscribe
- Mute
- Subscribe to RSS Feed
- Permalink
- Report Inappropriate Content
LOAD *, If( [Data Documento Fattura] > MonthEnd(Data)-1 and [Data Pagamento Rata] <= MonthEnd(Data) ,1,0) As Flag;
Hmm, I think that's a mistake by me. It should be the other way around:
LOAD *, If( [Data Pagamento Rata] > MonthEnd(Data)-1 and [Data Documento Fattura] <= MonthEnd(Data) ,1,0) As Flag;
talk is cheap, supply exceeds demand
- « Previous Replies
-
- 1
- 2
- Next Replies »