Unlock a world of possibilities! Login now and discover the exclusive benefits awaiting you.
- Qlik Community
- :
- All Forums
- :
- QlikView App Dev
- :
- Line chart : Average value from start until value ...
Options
- Subscribe to RSS Feed
- Mark Topic as New
- Mark Topic as Read
- Float this Topic for Current User
- Bookmark
- Subscribe
- Mute
- Printer Friendly Page
Turn on suggestions
Auto-suggest helps you quickly narrow down your search results by suggesting possible matches as you type.
Showing results for
Contributor II
2018-02-22
06:48 AM
- Mark as New
- Bookmark
- Subscribe
- Mute
- Subscribe to RSS Feed
- Permalink
- Report Inappropriate Content
Line chart : Average value from start until value of point
I have a table with these fields Symbol,Code,Value:
| Symbol | Code | Value |
| S1 | A1 | 110 |
| S1 | A2 | 100 |
| S1 | A5 | 105 |
| S1 | A6 | 108 |
| S2 | B3 | 120 |
| S2 | B5 | 150 |
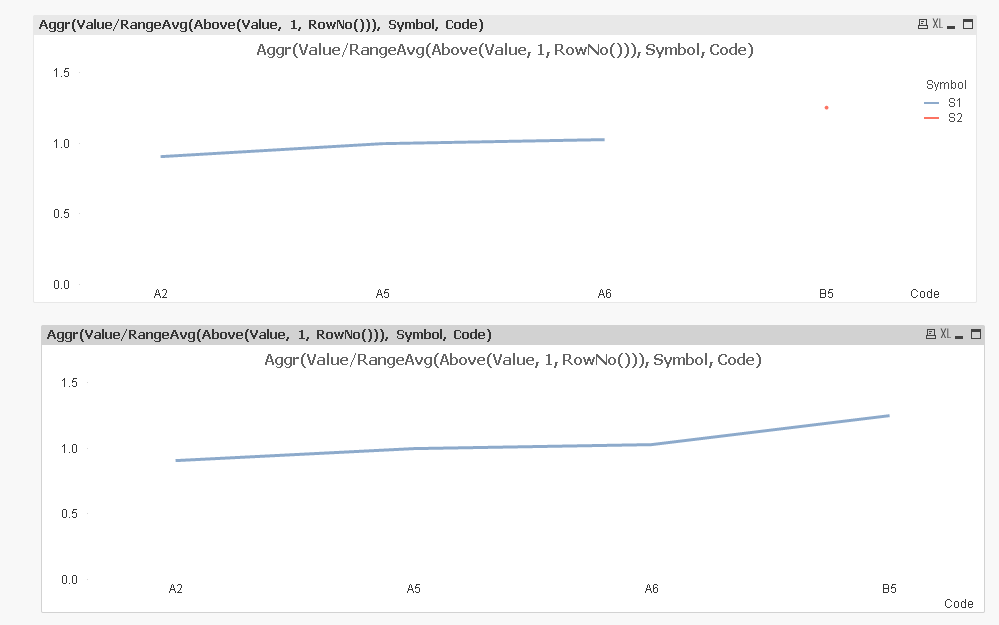
I want to show a line chart with dim="Symbol" and exp="Value/AVG", that AVG is average of value before current value. for example for symbol=S1 and Code=A5 the AVG is 105=(110+100)/2 and for Symbol=S1 and Code=A6, AVG is 105.75=(110+100+105+108)/4.
How I can do this?
577 Views
1 Solution
Accepted Solutions
MVP
2018-02-22
06:56 AM
- Mark as New
- Bookmark
- Subscribe
- Mute
- Subscribe to RSS Feed
- Permalink
- Report Inappropriate Content
437 Views
3 Replies
MVP
2018-02-22
06:51 AM
- Mark as New
- Bookmark
- Subscribe
- Mute
- Subscribe to RSS Feed
- Permalink
- Report Inappropriate Content
Do you mean to have Code as your dimension?
437 Views
MVP
2018-02-22
06:56 AM
- Mark as New
- Bookmark
- Subscribe
- Mute
- Subscribe to RSS Feed
- Permalink
- Report Inappropriate Content
Something like this?
438 Views
Contributor II
2018-02-24
12:14 AM
Author
- Mark as New
- Bookmark
- Subscribe
- Mute
- Subscribe to RSS Feed
- Permalink
- Report Inappropriate Content
Thanks. You help me alot.
437 Views