Unlock a world of possibilities! Login now and discover the exclusive benefits awaiting you.
- Qlik Community
- :
- All Forums
- :
- QlikView App Dev
- :
- Re: Linear regression Linest_M + Linest_B
- Subscribe to RSS Feed
- Mark Topic as New
- Mark Topic as Read
- Float this Topic for Current User
- Bookmark
- Subscribe
- Mute
- Printer Friendly Page
- Mark as New
- Bookmark
- Subscribe
- Mute
- Subscribe to RSS Feed
- Permalink
- Report Inappropriate Content
Linear regression Linest_M + Linest_B
Hi all,
I want to forecast the amount of orders for the coming months. I've created a master calendar which adds dates for + 1 year after the max date in the data (so that I can forecast multiple months ahead).
However, the linest_m and linest_b aren't calculating the correct numbers.
To calculate the forecast I'm using the following functions:
(LINEST_M( TOTAL Aggr(Count([Werkorder partner]), [Maand melding]), [Maand melding]) * NUM([Maand melding]) )+
LINEST_B(TOTAL Aggr(Count([Werkorder partner]), [Maand melding]), [Maand melding])
As you can see the X is 72,30, when I calculate it manually however I get: 903 / 8 = 112,875 and B -111,875.
I've tried forcing the graph to start in (0,0) with
(LINEST_M( TOTAL Aggr(Count([Werkorder partner]), [Maand melding]), [Maand melding],0,0)
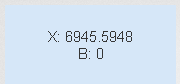
but this returns x as 6945,5948???
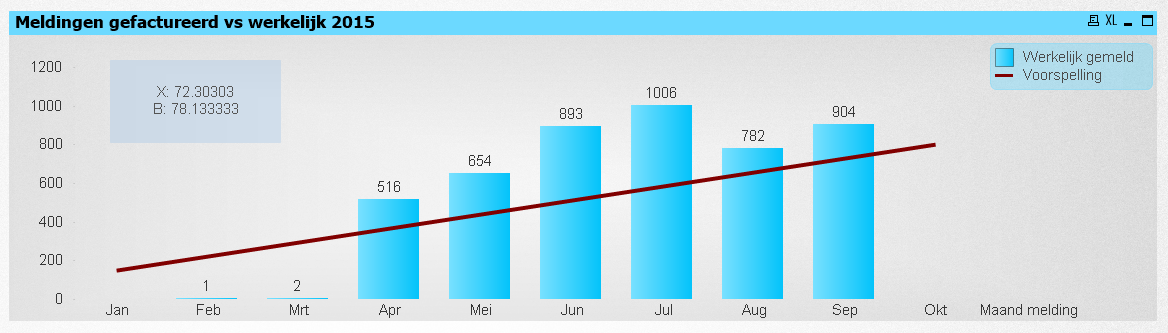
The correct formula (I think) should be: 112,875X - 111,875. Just have to get qlik to understand that 
Accepted Solutions
- Mark as New
- Bookmark
- Subscribe
- Mute
- Subscribe to RSS Feed
- Permalink
- Report Inappropriate Content
- Mark as New
- Bookmark
- Subscribe
- Mute
- Subscribe to RSS Feed
- Permalink
- Report Inappropriate Content
The chart doesn't start at 0. It starts at Jan. That's the first 'row' of the chart.
talk is cheap, supply exceeds demand
- Mark as New
- Bookmark
- Subscribe
- Mute
- Subscribe to RSS Feed
- Permalink
- Report Inappropriate Content
Please have a look at
Matching linest_m and linest_b function to auto-generated trendline
- Mark as New
- Bookmark
- Subscribe
- Mute
- Subscribe to RSS Feed
- Permalink
- Report Inappropriate Content
So you suggest I should use linest_m( ....,..., 0,1)? I'll test it tonight.
- Mark as New
- Bookmark
- Subscribe
- Mute
- Subscribe to RSS Feed
- Permalink
- Report Inappropriate Content
I'm not sure if I understand the post, you suggest to rank the month dimension in the linest_ functions?
- Mark as New
- Bookmark
- Subscribe
- Mute
- Subscribe to RSS Feed
- Permalink
- Report Inappropriate Content
Converting the dimension doesn't fixed the problem. 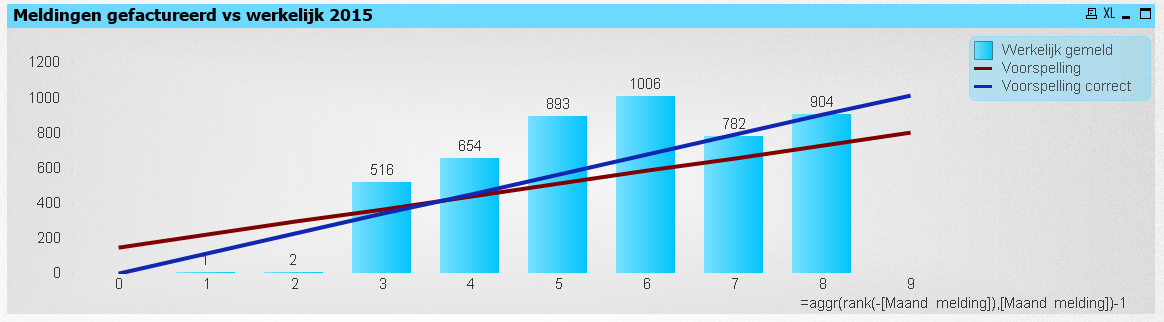
- Mark as New
- Bookmark
- Subscribe
- Mute
- Subscribe to RSS Feed
- Permalink
- Report Inappropriate Content
Could you upload a small sample QVW?
- Mark as New
- Bookmark
- Subscribe
- Mute
- Subscribe to RSS Feed
- Permalink
- Report Inappropriate Content
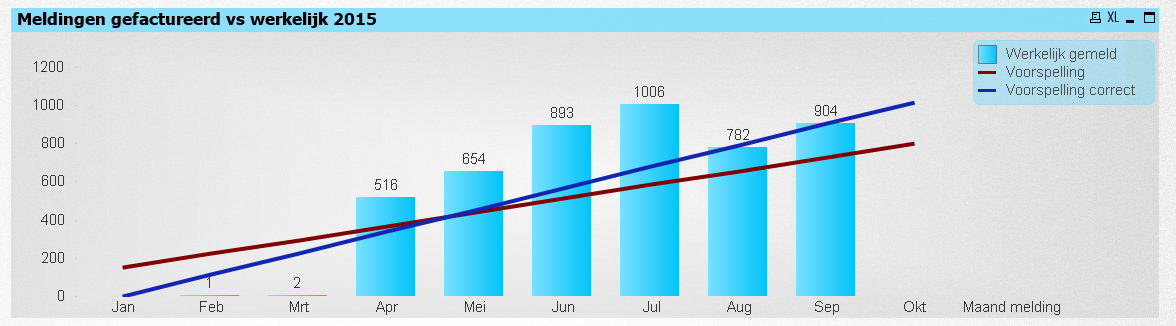
Okay got the linear regression correct, as in equal to the one qlikview calculates. But I still think the regression should be 112,875X - 111,875 not 72,30x + 150,44 as qlikview calculates. I think this has to do with the fact that a count of the orders in january returns null, as well as okt nov dec.