Unlock a world of possibilities! Login now and discover the exclusive benefits awaiting you.
- Qlik Community
- :
- All Forums
- :
- QlikView App Dev
- :
- Master Calender + line chart
- Subscribe to RSS Feed
- Mark Topic as New
- Mark Topic as Read
- Float this Topic for Current User
- Bookmark
- Subscribe
- Mute
- Printer Friendly Page
- Mark as New
- Bookmark
- Subscribe
- Mute
- Subscribe to RSS Feed
- Permalink
- Report Inappropriate Content
Master Calender + line chart
Hi all,
I have a problem with my master calender and my line chart. I have a master calender for a couple of years and i created a line chart that shows me sum(profit) for each year and calenderweek and weekday. calendarweek and weekday are one dimension like cw & ' ' & wd.
everything is showing correctly except on dates where i dont have a profit value. meaning on the first of may over here it is always a holiday so we have no profit. but my dimension is always calendarweek + weekday so so for example calenderweek 17 Monday was one in 2009 the first of may and in 2010 ist was the second of may(has profit) so my lines are not showing 0 for 2009 it is jsut being ignored and jumps automaticly to the next date.
can someone help me how i can fix this?
my tables are:
Master claender with the columns Date, Weekday, Week, year, month
and the table:
movement with the columns Date (connection to master calender) , profit
and movement has only lines for the dates where we had profit
regards,
MT
- « Previous Replies
-
- 1
- 2
- Next Replies »
- Mark as New
- Bookmark
- Subscribe
- Mute
- Subscribe to RSS Feed
- Permalink
- Report Inappropriate Content
Create a value of dates in a single table.
Join 0 as the value.
concatenate the table where not exists the date.
- Mark as New
- Bookmark
- Subscribe
- Mute
- Subscribe to RSS Feed
- Permalink
- Report Inappropriate Content
- Mark as New
- Bookmark
- Subscribe
- Mute
- Subscribe to RSS Feed
- Permalink
- Report Inappropriate Content
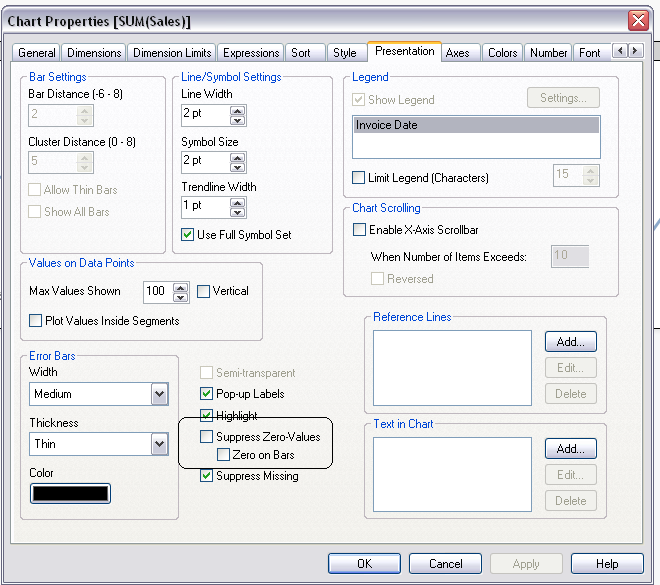
Zero Values,
- Make sure you got a calendar with all the months you want to display.
- Enable Continuous dimension axis
- Uncheck the Suppress Zero-Values under Presentation properties.
- « Previous Replies
-
- 1
- 2
- Next Replies »