Unlock a world of possibilities! Login now and discover the exclusive benefits awaiting you.
- Qlik Community
- :
- All Forums
- :
- QlikView App Dev
- :
- Re: Mouse hover text on Chart
- Subscribe to RSS Feed
- Mark Topic as New
- Mark Topic as Read
- Float this Topic for Current User
- Bookmark
- Subscribe
- Mute
- Printer Friendly Page
- Mark as New
- Bookmark
- Subscribe
- Mute
- Subscribe to RSS Feed
- Permalink
- Report Inappropriate Content
Mouse hover text on Chart
Dear community,
Is it possible to get the line chart as shown below?
1. Show text on the line chart
2. Text description pop up during mouse hover.
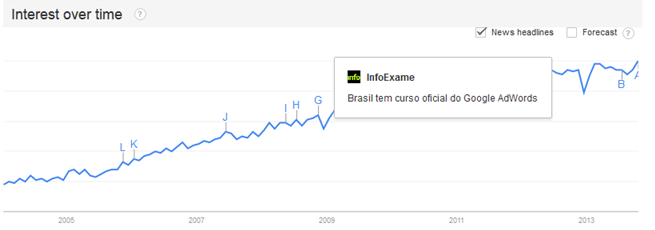
Thanks and best regards,
Chanel
Accepted Solutions
- Mark as New
- Bookmark
- Subscribe
- Mute
- Subscribe to RSS Feed
- Permalink
- Report Inappropriate Content
May be like attached sample?
- Mark as New
- Bookmark
- Subscribe
- Mute
- Subscribe to RSS Feed
- Permalink
- Report Inappropriate Content
Hi Chanel,
You can create a new field like Year & Chr(10) & Description As NewField.
Now you can use it in your dimensions, now as in this case you have four letters fixed for your year. So Now go to presentation tab -> Legend -> Click on the NewField -> check the property "Limit Legend (Characters)" and set the value in front of the text box to 5.
But this will show both Year and on a new line it will show the description but in your X Axis dimension it will only show the Year value.
Thanks....
- Mark as New
- Bookmark
- Subscribe
- Mute
- Subscribe to RSS Feed
- Permalink
- Report Inappropriate Content
May be like attached sample?
- Mark as New
- Bookmark
- Subscribe
- Mute
- Subscribe to RSS Feed
- Permalink
- Report Inappropriate Content
See there is already option of display of data points when the mouse hover on the points in chart.
- Mark as New
- Bookmark
- Subscribe
- Mute
- Subscribe to RSS Feed
- Permalink
- Report Inappropriate Content
Dear,
Current built in feature can only show the data points but I wish to show additional description on each data point when user mouse hover that particular point.
- Mark as New
- Bookmark
- Subscribe
- Mute
- Subscribe to RSS Feed
- Permalink
- Report Inappropriate Content
Thanks so much! it seems a bit complicated. i will try it out anyhow!
- Mark as New
- Bookmark
- Subscribe
- Mute
- Subscribe to RSS Feed
- Permalink
- Report Inappropriate Content
Awesome! I will try it out in my own document!
- Mark as New
- Bookmark
- Subscribe
- Mute
- Subscribe to RSS Feed
- Permalink
- Report Inappropriate Content
Hi,
I have a bar chart which shows percentage values. For example - % of Closed cases over Total cases. Each bar stands for % for different dates. What I want to be able to do is - when the mouse if hovered over one of the bars, the user should be able to see the count of numerator & the denominator - like - Closed cases(numerator) - 75, Total cases(denominator) - 100. How do I achieve this in Qliksense? Please advise and help me on this!!
