Unlock a world of possibilities! Login now and discover the exclusive benefits awaiting you.
- Qlik Community
- :
- All Forums
- :
- QlikView App Dev
- :
- Need help with set Analysis
- Subscribe to RSS Feed
- Mark Topic as New
- Mark Topic as Read
- Float this Topic for Current User
- Bookmark
- Subscribe
- Mute
- Printer Friendly Page
- Mark as New
- Bookmark
- Subscribe
- Mute
- Subscribe to RSS Feed
- Permalink
- Report Inappropriate Content
Need help with set Analysis
Hi, I have a question on set analysis,
Scenario:
I have the following table with Data:
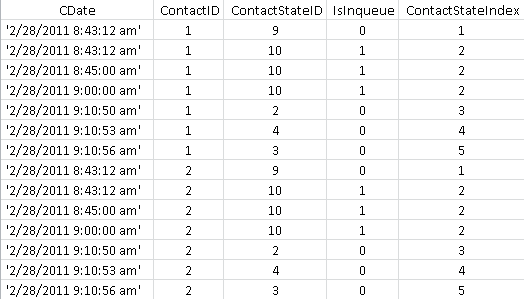
What I am trying to get is the the following:
1- Group the data in 15 min buckets --- Done
2- Count the number of Contact that match the following criteria on the same Bucket:
a- go from a "non-inqueue" ContactStateID to an "InQueue" ContactStateID --- Almost
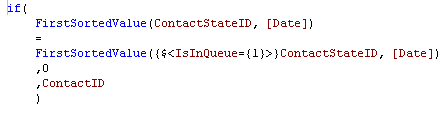
For #2 I am ordering all the corresponding ContactStateId's by ContactStateIndex and then asking:
Is the first StateID the same as the first "Inqueue" StateId for this bucket?
If the answer is NO, then its because the switch happened.
Ex.
It works Good, but only when 1 Contact is filtered 
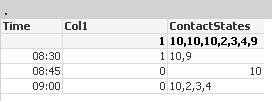
This is good, since at 8:30 was exactly the switch from "non-inqueue" to "Inqueue"
But when both Contacts are shown
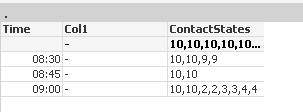
Any Suggestions?
I have tried to make it work with Aggr, nondistinct, nested set analysis, and still no white smoke.
Thanks in advance for your time.
-Ed
Accepted Solutions
- Mark as New
- Bookmark
- Subscribe
- Mute
- Subscribe to RSS Feed
- Permalink
- Report Inappropriate Content
How about this?
-sum(aggr(min({1<IsInqueue={1}>} Date) = min({1<IsInqueue={1}>} total <ContactID> Date),QuarterTime,ContactID))
And while not really anything you're asking about, consider doing something like this for your QuarterTime for display purposes:
dual(time(floor(timestamp#(CDate), 1/96) ,'hh:mm') & '-' &
time(floor(timestamp#(CDate), 1/96) + 1/96,'hh:mm')
,floor(frac(timestamp#(CDate)),1/96)) as QuarterTime,
- Mark as New
- Bookmark
- Subscribe
- Mute
- Subscribe to RSS Feed
- Permalink
- Report Inappropriate Content
First I noticed that your timestamp is not properly loaded in the script. Since your data is a string you need to load is as Timestamp(TimeStamp#(CDate)) to generate a poper TimeStamp value.
Following on that you should reset the Document formatting for fields so that they get the proper formatting. It can be a good idea to uncheck Survive Reload and instead control data types via the script. In this case you might want to also Reset the fields to "Default from Input"
Settings > Document Properties > Number
Using to complex calculated dimensions can easily cause decreased performance in your application, so it is suggested that you move the 15 min period expression to the script instead, and then set the loaded field as your dimension.
By adding the expression components as expressions you could get an idea of what is happening in your expression. In this case I am not really sure what values you re expecting on each row, so please clarify that for further support.
- Mark as New
- Bookmark
- Subscribe
- Mute
- Subscribe to RSS Feed
- Permalink
- Report Inappropriate Content
Thanks a lot Toni, great suggestions in performance! 
About the expected values on each row, I am jus trying to get a Count of Contacts, that did switch from Isinqueue={0} to IsInQueue={1} ContactStateId's.
This means that for bucket 8:30 the value should be 2, since both ContactID 1 and 2 came from a Isinqueue={0} to IsInQueue={1}
Something like:
if(
FirstSortedValue(ContactStateID, [Date])
=
FirstSortedValue({$<IsInQueue={1}>}ContactStateID, [Date])
,0
, Distinct ContactID
)
????? but the script does not allow the Distinct.
Regards
-Ed
- Mark as New
- Bookmark
- Subscribe
- Mute
- Subscribe to RSS Feed
- Permalink
- Report Inappropriate Content
I suspect QuarterTime should be a time instead of a timestamp. You're not displaying the date, so it should probably be removed by using frac(). Unless you need it to be sensitive to selections (I'm not sure why it would be), you could establish a FirstIsInQueue flag for the first timestamp where IsInqueue is set for each contact ID.
time(frac(floor(timestamp#(CDate),1/96)),'hh:mm') as QuarterTime,
if(IsInqueue and (ContactID<>previous(ContactID) or previous(IsInqueue=0)),1) as FirstIsInQueue,
Then you just sum the new flag.
sum(FirstIsInQueue)
- Mark as New
- Bookmark
- Subscribe
- Mute
- Subscribe to RSS Feed
- Permalink
- Report Inappropriate Content
Wow, great suggestion John, sadly, when I posted the file, it was just a mock up of our actual data model, I actually have multiple tables that I am combining into a pivot table, so this is why I am trying to solve this at the expression level. 
I was also trying to somehow, analyse the whole dataset by using 1<$> as in :
if(
FirstSortedValue({1<IsInQueue={0}>}ContactStateID, [Date])
<>
FirstSortedValue({1<IsInQueue={1}>}ContactStateID, [Date])
,Count(Distinct ContactID)
,0
)
but FirstSortedValue is not behaving as I expected.
Any suggestion on how, even at high CPU load, drive that sum?
Thanks a lot for your time.
-Ed
- Mark as New
- Bookmark
- Subscribe
- Mute
- Subscribe to RSS Feed
- Permalink
- Report Inappropriate Content
How about this?
-sum(aggr(min({1<IsInqueue={1}>} Date) = min({1<IsInqueue={1}>} total <ContactID> Date),QuarterTime,ContactID))
And while not really anything you're asking about, consider doing something like this for your QuarterTime for display purposes:
dual(time(floor(timestamp#(CDate), 1/96) ,'hh:mm') & '-' &
time(floor(timestamp#(CDate), 1/96) + 1/96,'hh:mm')
,floor(frac(timestamp#(CDate)),1/96)) as QuarterTime,
- Mark as New
- Bookmark
- Subscribe
- Mute
- Subscribe to RSS Feed
- Permalink
- Report Inappropriate Content
Wow John, it worked perfectly, i was trying to understand your approach but honestly, there are things I didnt even had used on set Analysis, can you please explain a little bit the solution?
I have a couple of questions:
- why the sum gives a negative result?
- how exactly is that "total <ContactID>" behaves in the comparisson expression of your Aggr
- "QuarterTime,ContactID" I didnt knew you could provide more than 1 dimention to an Aggr, Am I correct?
Thanks again for all you rhelp, I must admit, you rock! 
Regards
-Ed
- Mark as New
- Bookmark
- Subscribe
- Mute
- Subscribe to RSS Feed
- Permalink
- Report Inappropriate Content
1) The -sum() is taking advantage of the internal representation of true() as -1 and false() as 0. So this:
-sum(condition)
Is equivalent to the more-easily understood:
sum(if(condition,1))
You might want to write it the second way. I have a bad habit of squeezing every "extraneous" byte out of my code, sometimes at the expense of clarity.
2) The total <ContactID> says to look at ALL Dates for that specific contact ID, not just the Dates that are in the 15 minute range associated with the row on the chart. So what min({1<IsInqueue={1}>} total <ContactID> Date) is doing in this context is getting the very first timestamp for the contact ID where we were in queue. Then the min({1<IsInqueue={1}>} Date) finds the same thing, but only within our 15 minute range. Comparing them then lets you know if the first time we were in queue happened during our 15 minute range. It's the same basic approach you were attempting, I believe.
3) You can provide as many dimensions to an aggr() as you want, and providing more than one is very common. These dimensions do not have to actually be in your chart. It's as if you're making a whole new chart internally. In fact, I often design more complicated aggr()s by creating a separate chart with the aggr() dimensions, and seeing if I get the result I intended before I finish the expression and put it back in the main chart.
- Mark as New
- Bookmark
- Subscribe
- Mute
- Subscribe to RSS Feed
- Permalink
- Report Inappropriate Content
Thanks again John, very descriptive explanation!
-Ed