Unlock a world of possibilities! Login now and discover the exclusive benefits awaiting you.
- Qlik Community
- :
- All Forums
- :
- QlikView App Dev
- :
- Pareto Chart
- Subscribe to RSS Feed
- Mark Topic as New
- Mark Topic as Read
- Float this Topic for Current User
- Bookmark
- Subscribe
- Mute
- Printer Friendly Page
- Mark as New
- Bookmark
- Subscribe
- Mute
- Subscribe to RSS Feed
- Permalink
- Report Inappropriate Content
Pareto Chart
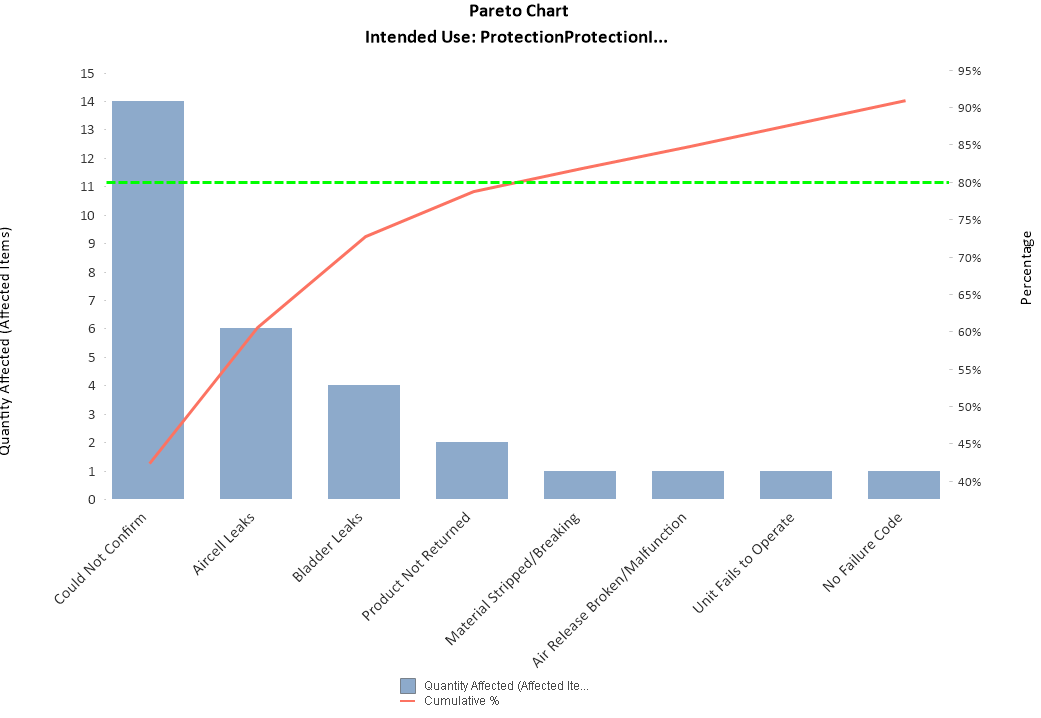
I have a pareto chart in my application (see attached). Some of the dimension values are Null. When I suppress NUll values I don't see the 100% on the Cumulative Line chart. But I show Null values then I can see the cumulative % values until 100%. How do I show 20 - 100% all values and not count Null dimension values for the chart?
- Mark as New
- Bookmark
- Subscribe
- Mute
- Subscribe to RSS Feed
- Permalink
- Report Inappropriate Content
That gives me 130. Why is it not showing 133?
- Mark as New
- Bookmark
- Subscribe
- Mute
- Subscribe to RSS Feed
- Permalink
- Report Inappropriate Content
I get 133 without the Failure Detail filter
- Mark as New
- Bookmark
- Subscribe
- Mute
- Subscribe to RSS Feed
- Permalink
- Report Inappropriate Content
I removed the Failure Detail filter from the Cumulative % expression and it all sums up perfectly.
- Mark as New
- Bookmark
- Subscribe
- Mute
- Subscribe to RSS Feed
- Permalink
- Report Inappropriate Content
Super
- Mark as New
- Bookmark
- Subscribe
- Mute
- Subscribe to RSS Feed
- Permalink
- Report Inappropriate Content
Sunny, I have another question: On the pareto chart I want to show dimension values until 80%, and club those that are 80-100% and show one value as "Others". So on the chart I would see bars until 80% and then one last bar with a sharp spike from 80 to 100% and the dimension value for that bar needs to be "Others". Any ideas on how to do this?
- Mark as New
- Bookmark
- Subscribe
- Mute
- Subscribe to RSS Feed
- Permalink
- Report Inappropriate Content
The cumulative % expression is not working correctly for all selections. Is the below expression correct?
RangeSum(Above(Sum([Quantity Affected]), 0, RowNo())) / Sum(TOTAL [Quantity Affected])
- Mark as New
- Bookmark
- Subscribe
- Mute
- Subscribe to RSS Feed
- Permalink
- Report Inappropriate Content
Looks okay...
- Mark as New
- Bookmark
- Subscribe
- Mute
- Subscribe to RSS Feed
- Permalink
- Report Inappropriate Content
I have a filter that groups several parts and when I select one of those the total does not come up to 100%.
The sample I attached is when I selected a value for this above filter and a part number. I just noticed the cumulative % is not working for all selections. See attached. The last bar does not show a 100%. The calculations are not correct ( I checked doing it manually and they are completely incorrect). Not sure what is wrong,
- Mark as New
- Bookmark
- Subscribe
- Mute
- Subscribe to RSS Feed
- Permalink
- Report Inappropriate Content
Sum(TOTAL [Quantity Affected]) is calculating right for the first selection but when I selected first filter and a product this value is incorrect unless I add {<[Failure Detail] *= {"*"}>}.
So something is really wrong. My expressions are not working in all scenarios. Any idea what could be causing this?
- Mark as New
- Bookmark
- Subscribe
- Mute
- Subscribe to RSS Feed
- Permalink
- Report Inappropriate Content
Attached is the dimension I used. If you look at the data table there are multiple records for the same dimension. Could this be causing the total to not work correctly? If so how to fix this?