Unlock a world of possibilities! Login now and discover the exclusive benefits awaiting you.
- Qlik Community
- :
- All Forums
- :
- QlikView App Dev
- :
- Re: Problem displaying linest_M in a straight tabl...
- Subscribe to RSS Feed
- Mark Topic as New
- Mark Topic as Read
- Float this Topic for Current User
- Bookmark
- Subscribe
- Mute
- Printer Friendly Page
- Mark as New
- Bookmark
- Subscribe
- Mute
- Subscribe to RSS Feed
- Permalink
- Report Inappropriate Content
Problem displaying linest_M in a straight table
I am attempting to display multiple trend lines on a straight table through the use of the linest_M function. Currently, the correct slope calculation appears only after I have selected one “product-code”.
Here is my expression:
=LINEST_M(aggr(((sum(extMargin)/sum(extPrice))*100),[product-code],MonthYear),(aggr(rank(-MonthYear),MonthYear)-1))
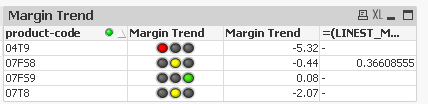
current multiple selection output. (three values are '-' and one is 0.366 which is incorrect)
current single selection output. (linest_M value is correct @ -2.17)

how do I display all linest_M values for each selected "Product-code" at the same time??
Accepted Solutions
- Mark as New
- Bookmark
- Subscribe
- Mute
- Subscribe to RSS Feed
- Permalink
- Report Inappropriate Content
Maybe
=LINEST_M(aggr(((sum(extMargin)/sum(extPrice))*100),[product-code],MonthYear),(aggr(rank(-MonthYear),[product-code], MonthYear)-1))
- Mark as New
- Bookmark
- Subscribe
- Mute
- Subscribe to RSS Feed
- Permalink
- Report Inappropriate Content
please post sample app
thanks
regards
Marco
- Mark as New
- Bookmark
- Subscribe
- Mute
- Subscribe to RSS Feed
- Permalink
- Report Inappropriate Content
Maybe
=LINEST_M(aggr(((sum(extMargin)/sum(extPrice))*100),[product-code],MonthYear),(aggr(rank(-MonthYear),[product-code], MonthYear)-1))