Unlock a world of possibilities! Login now and discover the exclusive benefits awaiting you.
- Qlik Community
- :
- All Forums
- :
- QlikView App Dev
- :
- Re: Qlikview Dynamic Stacked bar chart
- Subscribe to RSS Feed
- Mark Topic as New
- Mark Topic as Read
- Float this Topic for Current User
- Bookmark
- Subscribe
- Mute
- Printer Friendly Page
- Mark as New
- Bookmark
- Subscribe
- Mute
- Subscribe to RSS Feed
- Permalink
- Report Inappropriate Content
Qlikview Dynamic Stacked bar chart
Hi,
I would like to create a stacked bar chart with dynamic groups.
Currently I have created 4 expressions. I would like to load dynamically. Please help.
Accepted Solutions
- Mark as New
- Bookmark
- Subscribe
- Mute
- Subscribe to RSS Feed
- Permalink
- Report Inappropriate Content
you can use Primary Add PrimaryPriority in dimension and
use below expression
Count ( {$<[TicketTypeId]={'1'}>}TicketNumber)
Thanks
BKC
- Mark as New
- Bookmark
- Subscribe
- Mute
- Subscribe to RSS Feed
- Permalink
- Report Inappropriate Content
Can you expand on what you mean by dynamic dimensions?
It appears you have four in play, two showing in the chart.
- Mark as New
- Bookmark
- Subscribe
- Mute
- Subscribe to RSS Feed
- Permalink
- Report Inappropriate Content
do you mean using a cyclic group ?
- Mark as New
- Bookmark
- Subscribe
- Mute
- Subscribe to RSS Feed
- Permalink
- Report Inappropriate Content
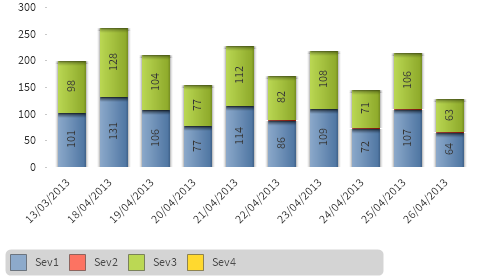
What I mean dynamic is, right now i have created 4 expressions like sev1, sev2, sev3, sev4 like below,
=Count ( {$<[TicketTypeId]={'1'}, PrimaryPriority={'sev1'}>}TicketNumber)
=Count ( {$<[TicketTypeId]={'1'}, PrimaryPriority={'sev2'}>}TicketNumber)
=Count ( {$<[TicketTypeId]={'1'}, PrimaryPriority={'sev3'}>}TicketNumber)
=Count ( {$<[TicketTypeId]={'1'}, PrimaryPriority={'sev4'}>}TicketNumber)
So i am getting 4 groups in stacked bar chart. Now Incase if one more severity gets added i may have to come back to the expression and add another. I would like to load theses stacked groups dynamically.
- Mark as New
- Bookmark
- Subscribe
- Mute
- Subscribe to RSS Feed
- Permalink
- Report Inappropriate Content
you can use Primary Add PrimaryPriority in dimension and
use below expression
Count ( {$<[TicketTypeId]={'1'}>}TicketNumber)
Thanks
BKC
- Mark as New
- Bookmark
- Subscribe
- Mute
- Subscribe to RSS Feed
- Permalink
- Report Inappropriate Content
find example
- Mark as New
- Bookmark
- Subscribe
- Mute
- Subscribe to RSS Feed
- Permalink
- Report Inappropriate Content
Try some thing like this
Dimensions: date and PrimaryPriority
Expression : Count ( {$<[TicketTypeId]={'1'}>}TicketNumber)
In presentation tab enable the 'stacked' option
- Mark as New
- Bookmark
- Subscribe
- Mute
- Subscribe to RSS Feed
- Permalink
- Report Inappropriate Content
Thanks Pradeep and balkumar. That really works. Now I am trying to show a line in the same chart to show the total no of tickets. But if i add one more expression am getting the total for all severity.
am trying to achieve something like this,
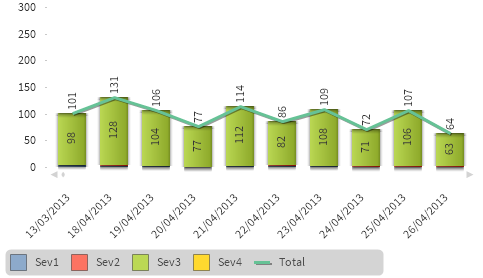
Please help.
- Mark as New
- Bookmark
- Subscribe
- Mute
- Subscribe to RSS Feed
- Permalink
- Report Inappropriate Content
in a Bar chart/Line chart/Combo chart, 2 dimensions with 2 expressions is not possible
- Mark as New
- Bookmark
- Subscribe
- Mute
- Subscribe to RSS Feed
- Permalink
- Report Inappropriate Content
Is there any other workaround to achieve my requirement?