Unlock a world of possibilities! Login now and discover the exclusive benefits awaiting you.
- Qlik Community
- :
- All Forums
- :
- QlikView App Dev
- :
- Reverse max and min value on a chart
- Subscribe to RSS Feed
- Mark Topic as New
- Mark Topic as Read
- Float this Topic for Current User
- Bookmark
- Subscribe
- Mute
- Printer Friendly Page
- Mark as New
- Bookmark
- Subscribe
- Mute
- Subscribe to RSS Feed
- Permalink
- Report Inappropriate Content
Reverse max and min value on a chart
Hello,
I'm wondering if it's possible to reverse the axis values on a chart, where the highest value is at the bottom and the lowest value is at the top.
Can this be done?
- Mark as New
- Bookmark
- Subscribe
- Mute
- Subscribe to RSS Feed
- Permalink
- Report Inappropriate Content
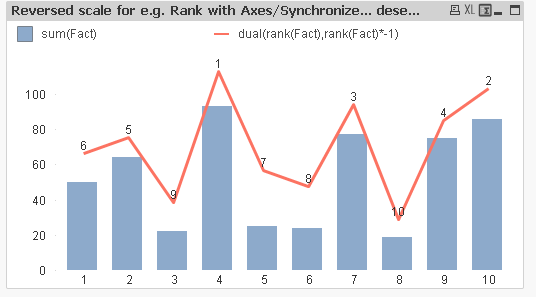
Do you have something like this in mind?
- Mark as New
- Bookmark
- Subscribe
- Mute
- Subscribe to RSS Feed
- Permalink
- Report Inappropriate Content
Something like this?
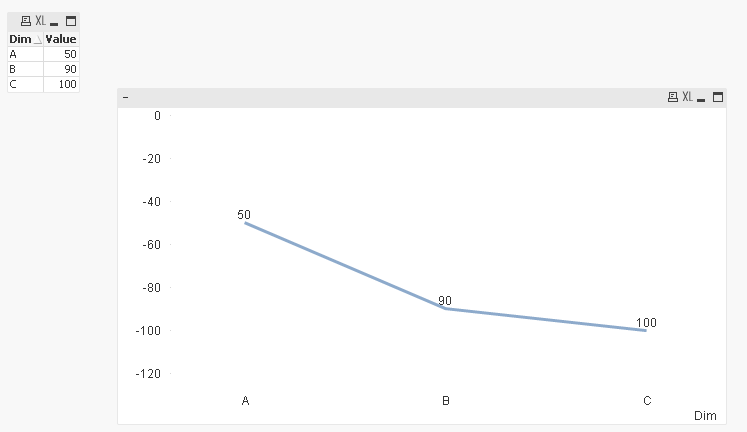
Expression used:
=Dual(Value, -Value)
Only issue might be the axis showing negative numbers 
- Mark as New
- Bookmark
- Subscribe
- Mute
- Subscribe to RSS Feed
- Permalink
- Report Inappropriate Content
Thank you for the reply swuehl! Yes, this is similar to what I'm looking for. Is it possible to put this into a radar chart?
I'm essentially trying to create a bull's eye chart
- Mark as New
- Bookmark
- Subscribe
- Mute
- Subscribe to RSS Feed
- Permalink
- Report Inappropriate Content
If I understand your request correctly, I would rather look into a scatter chart.
Maybe I don't, so please post a more complete description of what you want to achieve, maybe some sample lines of records and your expected result e.g. as sketch drawing, too.
- Mark as New
- Bookmark
- Subscribe
- Mute
- Subscribe to RSS Feed
- Permalink
- Report Inappropriate Content

- Mark as New
- Bookmark
- Subscribe
- Mute
- Subscribe to RSS Feed
- Permalink
- Report Inappropriate Content
If you need to show the values in reverse such as when you RANK() a value then you can use the following. You can use it when only showing a single expression too.