Unlock a world of possibilities! Login now and discover the exclusive benefits awaiting you.
- Qlik Community
- :
- All Forums
- :
- QlikView App Dev
- :
- Re: Set analysis on last 12 months, based on selec...
- Subscribe to RSS Feed
- Mark Topic as New
- Mark Topic as Read
- Float this Topic for Current User
- Bookmark
- Subscribe
- Mute
- Printer Friendly Page
- Mark as New
- Bookmark
- Subscribe
- Mute
- Subscribe to RSS Feed
- Permalink
- Report Inappropriate Content
Set analysis on last 12 months, based on selected quarter
Good day,
I think I am near to solving this but I have hit a wall. The below expression returns monthly counts for the last twelve months based on a selected quarter, but the counts are way higher than what they should be (hundreds of Ks instead of a few dozens).
=Count({1<[CaseDates.Calendar Date] = {">=$(=MonthStart(Max([CaseDates.Calendar Date]), -12))<=$(=MonthEnd(Max([CaseDates.Calendar Date])))"},[CaseDates.Month Name]=,[CaseDates.Calendar Year]=>} DISTINCT [Case Number])
I am sure it is something silly but I have had no luck solving it.
Thanks.
- Mark as New
- Bookmark
- Subscribe
- Mute
- Subscribe to RSS Feed
- Permalink
- Report Inappropriate Content
To begin with you get the count for the last 13 months, but that's minor. Did you associate the tables correctly? Look at the Table Viewer to check the tables are connected. It sounds like you're seeing the result of a cartesian product. Can you prepare an example document with the problem?
talk is cheap, supply exceeds demand
- Mark as New
- Bookmark
- Subscribe
- Mute
- Subscribe to RSS Feed
- Permalink
- Report Inappropriate Content
Hi,
this adding 13 months no 12, adding 12 months last and 1 month actual
is expression, adding last 12 months
=Count({1<[CaseDates.Calendar Date] = {">=$(=MonthStart(Max([CaseDates.Calendar Date]), -12))<$(=MonthStart(Max([CaseDates.Calendar Date])))"},[CaseDates.Month Name]=,[CaseDates.Calendar Year]=>} DISTINCT [Case Number])
- Mark as New
- Bookmark
- Subscribe
- Mute
- Subscribe to RSS Feed
- Permalink
- Report Inappropriate Content
Hi Gysbert
Just notice that you already ahead of johnW . well done and keep up with your contribution. Many people benefit from you.
Paul
- Mark as New
- Bookmark
- Subscribe
- Mute
- Subscribe to RSS Feed
- Permalink
- Report Inappropriate Content
Thanks Gysbert.
I have used this table layout in many charts and tables so far without a problem. It's just the first time I try to do a set analysis statement with values outside of the selection. I will try to upload a sample shortly.
Using the same selection, I did a simple =Count(DISTINCT [Case Number]) and the correct values show up in the correct months of the selected quarter. So I am thinking the problem has something to do with [CaseDates.Calendar Date], which carries many more values for each [Case Number], e.i "Open Timestamp", "Closed Timestamp", Updated Timestamp", etc.. I thought using DISTINCT would alleviate that.
- Mark as New
- Bookmark
- Subscribe
- Mute
- Subscribe to RSS Feed
- Permalink
- Report Inappropriate Content
One more clue:
When I change the set identifier from 1 to $, expectedly the chart shows only three bars for the three month in the selected quarter, but the counts for each month are correct. Whereas if the set indentifier is 1, and 12 past months are showing, the counts become way off.
- Mark as New
- Bookmark
- Subscribe
- Mute
- Subscribe to RSS Feed
- Permalink
- Report Inappropriate Content
One more clue:
From the above expression, when I change the set identifier from 1 to $, expectedly the chart shows only three bars for the three month in the selected quarter, but the counts for each month are correct. Whereas if the set indentifier is 1, and 12 past months are showing, the counts become way off.
- Mark as New
- Bookmark
- Subscribe
- Mute
- Subscribe to RSS Feed
- Permalink
- Report Inappropriate Content
Check that the date format returned by $(=MonthStart(Max([CaseDates.Calendar Date]), -12)) and $(=MonthEnd(Max([CaseDates.Calendar Date]))) is the same as that of [CaseDates.Calendar Date]. If the formats don't match you might get the count of all the records.
talk is cheap, supply exceeds demand
- Mark as New
- Bookmark
- Subscribe
- Mute
- Subscribe to RSS Feed
- Permalink
- Report Inappropriate Content
I checked and everything has the same format as [CaseDates.Calenda]
I have simplified the expression a little bit but I have the same problem. And again, if I use the $ set identifier (i.e current selection), the returned values for 3 months are corrrect. However if I use the "1" set indentifier (i.e all values), 12 months are showing but they are all wrong.
Here is the latest expression:
=Count({1<[CaseDates.Calendar Date]={">=$(=MonthStart(Max([CaseDates.Calendar Date]), -11))<=$(=QuarterEnd(max([CaseDates.Calendar Date]),0,2))"},CaseDates.Type={'Opened'}>}DISTINCT [Case Number])
Note that adding "CaseDates.Type={'Opened'}>}" has reduced the counts by 75%, but the values are still far from what they should be.
See the attached screen grab.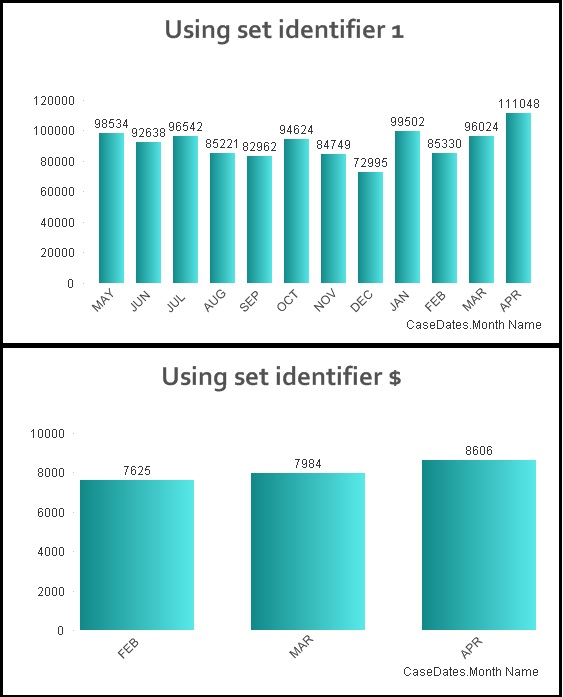
- Mark as New
- Bookmark
- Subscribe
- Mute
- Subscribe to RSS Feed
- Permalink
- Report Inappropriate Content
BINGO!
I think I found it. And it was thanks to another post from you Gysbert. I had to do an indirect set selection for all the fields needed in my data, as follows:
....[Account Name]=P([Account Name]),[Department]=P([Department]),[Substatus]=P([Substatus])...etc..
BUT
I am not happy about this solution. There's gotta be a simpler way to do this. Is there no way to say: "I want to show case counts for the last 12 months up to the selected quarter, and respect all other selections", i.e: not have to explicitely define indirect selections for each field I need.