Unlock a world of possibilities! Login now and discover the exclusive benefits awaiting you.
- Qlik Community
- :
- All Forums
- :
- QlikView App Dev
- :
- Show only last 12 Month with Dimension YearMonth
- Subscribe to RSS Feed
- Mark Topic as New
- Mark Topic as Read
- Float this Topic for Current User
- Bookmark
- Subscribe
- Mute
- Printer Friendly Page
- Mark as New
- Bookmark
- Subscribe
- Mute
- Subscribe to RSS Feed
- Permalink
- Report Inappropriate Content
Show only last 12 Month with Dimension YearMonth
Hello all,
I want to show sum of amount in chart (bar,line). Dimension I must use is YearMonth, then the case is when I click 'Jan' and Year '2012', the chart show only amount of last 12 month. Jan-2012, Dec-2011, Nov-2011, ... Feb-2011. Then, if I select Month from Jan-Apil, it will show the amount of last 12 Month from Max Month I select (April). I had try to use dimension limit and max show value, but it can't be like that. I want to set it in expression. Can you help me? Thanks before.
- Mark as New
- Bookmark
- Subscribe
- Mute
- Subscribe to RSS Feed
- Permalink
- Report Inappropriate Content
Hey Heri,
I think set analysis is the answer for your problem. I would create a sort order number for your YearMonth field. You can then use something like this in your set analysis expression:
Sum( {< YearMonth=, YearMonthOrder={$(v_12_month_set)} >} Amount), where v_12_month_set is a variable having the expressions for your sort order. It should be something like this:
= '"<=' & Max(YearMonthOrder) & ' >=' & Max(YearMonthOrder)-11 & '"'
Hope this helps! 
-Teemu
- Mark as New
- Bookmark
- Subscribe
- Mute
- Subscribe to RSS Feed
- Permalink
- Report Inappropriate Content
Dear Heri,
what I did was creating a variable as end date and from that a starting date for the x-axis:
vEndDate: =today()
vStartDate: =addmonth(today(), -12)
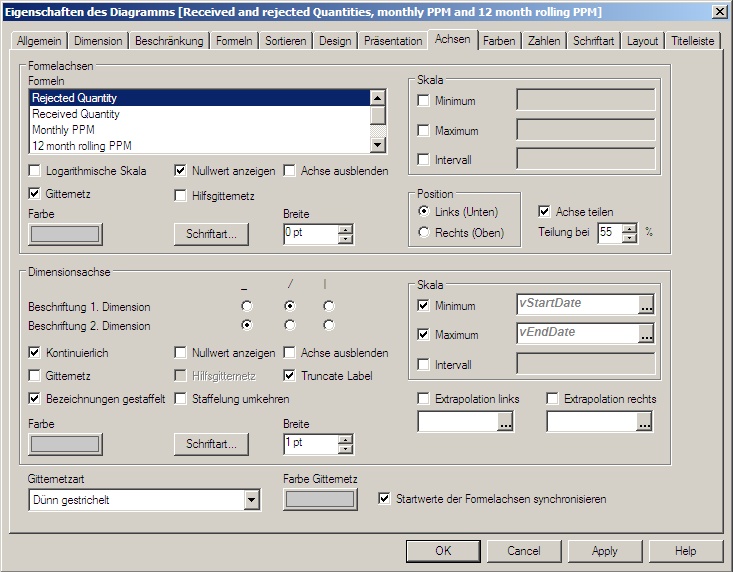
That gives me the last 12 month.
My problem is that I do a rolling 12 month calculation, which gives the correct value for the first month that is shown. But, it doesn't scale the y-axis correctly.