Unlock a world of possibilities! Login now and discover the exclusive benefits awaiting you.
- Qlik Community
- :
- All Forums
- :
- QlikView App Dev
- :
- Re: Simple Group By
- Subscribe to RSS Feed
- Mark Topic as New
- Mark Topic as Read
- Float this Topic for Current User
- Bookmark
- Subscribe
- Mute
- Printer Friendly Page
- Mark as New
- Bookmark
- Subscribe
- Mute
- Subscribe to RSS Feed
- Permalink
- Report Inappropriate Content
Simple Group By
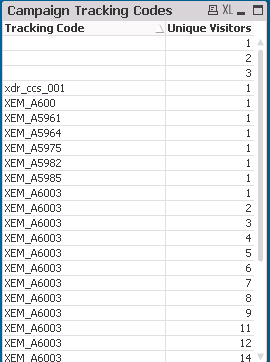
I am a noob here when it comes to QlikView. But basically, I have some data that I need to group (after it's been loaded). So I have a simple Table Box as follows where I just want to group by "Tracking Code." Below is a screenshot of the box. Can anyone tell me in how in the properties for this report that I can make this group by tracking code, in order to sum unique visitors? Thanks!
Accepted Solutions
- Mark as New
- Bookmark
- Subscribe
- Mute
- Subscribe to RSS Feed
- Permalink
- Report Inappropriate Content
Hi jassonegan,
I'm not sure understood you well on this. But let try to create pivot table with
1. Tracking Code as dimension
2. SUM([Unique Visitors]) as expression
Regards,
Sokkorn
- Mark as New
- Bookmark
- Subscribe
- Mute
- Subscribe to RSS Feed
- Permalink
- Report Inappropriate Content
Hi jassonegan,
I'm not sure understood you well on this. But let try to create pivot table with
1. Tracking Code as dimension
2. SUM([Unique Visitors]) as expression
Regards,
Sokkorn
- Mark as New
- Bookmark
- Subscribe
- Mute
- Subscribe to RSS Feed
- Permalink
- Report Inappropriate Content
You should be using a chart object not table box. Table box displays the data as it is. Use a chart object with straight table where is automatically groups the data.
Cheers,
Kiran.
- Mark as New
- Bookmark
- Subscribe
- Mute
- Subscribe to RSS Feed
- Permalink
- Report Inappropriate Content
hi,
For presentation, use chart rather than table box, in chart, use straight or pivot table, use
Tracking code as dimension and
use Sum([Unique Visitors]) as expression.
It automatically group the Tracking code and gives the result .
Hope it helps
Please close the thread by marking correct answer & give likes if you like the post.
- Mark as New
- Bookmark
- Subscribe
- Mute
- Subscribe to RSS Feed
- Permalink
- Report Inappropriate Content
Thanks for the help there. The pivot table gave me what I needed.