Unlock a world of possibilities! Login now and discover the exclusive benefits awaiting you.
- Qlik Community
- :
- All Forums
- :
- QlikView App Dev
- :
- Taking the correlation matrix further
- Subscribe to RSS Feed
- Mark Topic as New
- Mark Topic as Read
- Float this Topic for Current User
- Bookmark
- Subscribe
- Mute
- Printer Friendly Page
- Mark as New
- Bookmark
- Subscribe
- Mute
- Subscribe to RSS Feed
- Permalink
- Report Inappropriate Content
Taking the correlation matrix further
Hi all
I've implemented a Correlation Matrix similar to the one suggested here: Correlation matrix based on selection
I've done a duplicate/mirror table where table 1 has:
Period,
Sector,
Sales
table 2 has:
Period,
Sector1,
Sales1
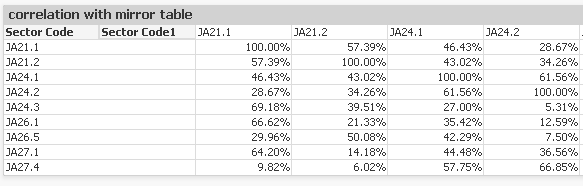
Building the chart works fine - I have a pivot table with Sector and Sector1 as dimensions and it is pivoted to have Sector on the X axis and Sector1 on the Y axis.
Expression is Correl(Sales, Sales1)
Works perfectly (see screenshot below)
This works If I select a specific period of time eg
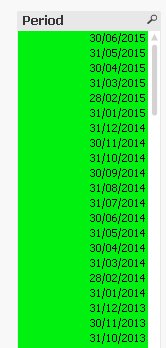
It shows over that specific period what the correlation matrix shows for my sectors.
What I'd like to do now is see what time period shows the best correlations for a particular sector.
eg the above might show correlations from 31/7/2010 to 30/6/2015 (60 months)... but maybe it turns out better for a particular sector if I run it from 1/1/2010 to 30/6/2015.
Is there any automated way of doing something like this?
cheers!