Unlock a world of possibilities! Login now and discover the exclusive benefits awaiting you.
- Qlik Community
- :
- All Forums
- :
- QlikView App Dev
- :
- Re: Total of previous 11 month and actual date val...
- Subscribe to RSS Feed
- Mark Topic as New
- Mark Topic as Read
- Float this Topic for Current User
- Bookmark
- Subscribe
- Mute
- Printer Friendly Page
- Mark as New
- Bookmark
- Subscribe
- Mute
- Subscribe to RSS Feed
- Permalink
- Report Inappropriate Content
Total of previous 11 month and actual date values
Hello I need to show in a chart 12 months columns, by which the last shown month would be the selected one.
And each of those month should be a sum of it and the 11 previous ones, that is called a TAM.
Ex;
Jun-2013 = values of the selected product in these dates
06/2013+05/2013+04/2013+03/2013+02/2013+01/2013+12/2012+11/2012+10/2012+09/2012+08/2012+07/2012
- Mark as New
- Bookmark
- Subscribe
- Mute
- Subscribe to RSS Feed
- Permalink
- Report Inappropriate Content
See this document: Calculating rolling n-period totals, averages or other aggregations
talk is cheap, supply exceeds demand
- Mark as New
- Bookmark
- Subscribe
- Mute
- Subscribe to RSS Feed
- Permalink
- Report Inappropriate Content
It is useful but doesn't apply for what i need, thank you very much.
- Mark as New
- Bookmark
- Subscribe
- Mute
- Subscribe to RSS Feed
- Permalink
- Report Inappropriate Content
Since Set Analysis is calculated once for the entire chart, you won't be able to do what you need with only one expression. You'd need to create a chart without dimensions and 12 expressions, and for each one use set analysis to set the min and max MonthYears you want to acumulate for it . For instance,
If you select June 2013:
June 2013: Jun 13 + May 13 + Apr 13 + Mar 13 + Feb 13 + Jan 13 + Dec 12 + Nov 12 + Sep 12 + Aug 12 + Jul12
May 2013 : May 13 + Apr 13 + Mar 13 + Feb 13 + Jan 13 + Dec 12 + Nov 12 + Sep 12 + Aug 12 + Jul12 + Jun 12
Apr 13 : Apr 13 + Mar 13 + Feb 13 + Jan 13 + Dec 12 + Nov 12 + Sep 12 + Aug 12 + Jul12 + Jun12 + May 12
and so on...
Hope it helps
- Mark as New
- Bookmark
- Subscribe
- Mute
- Subscribe to RSS Feed
- Permalink
- Report Inappropriate Content
Jun-2013 = values of the selected product in these dates
06/2013+05/2013+04/2013+03/2013+02/2013+01/2013+12/2012+11/2012+10/2012+09/2012+08/2012+07/2012
And May-2013 = ?
If it's 05/2013+04/2013+03/2013+02/2013+01/2013+12/2012+11/2012+10/2012+09/2012+08/2012+07/2012+06/2012 then you want is what I call a 12-month rolling total. In which case I wish you good luck doing this in any way that is not discussed in the document I referred to.
talk is cheap, supply exceeds demand
- Mark as New
- Bookmark
- Subscribe
- Mute
- Subscribe to RSS Feed
- Permalink
- Report Inappropriate Content
Yes May would look like that, here is an example made in excel so you can see:
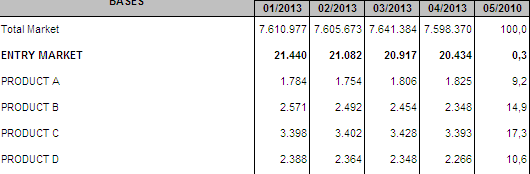
I have 6 products, and 5 columns in this example.
Each column represents a sum of months.