Unlock a world of possibilities! Login now and discover the exclusive benefits awaiting you.
- Qlik Community
- :
- All Forums
- :
- QlikView App Dev
- :
- Use two different dimensions as alternate filters ...
- Subscribe to RSS Feed
- Mark Topic as New
- Mark Topic as Read
- Float this Topic for Current User
- Bookmark
- Subscribe
- Mute
- Printer Friendly Page
- Mark as New
- Bookmark
- Subscribe
- Mute
- Subscribe to RSS Feed
- Permalink
- Report Inappropriate Content
Use two different dimensions as alternate filters for the same chart ?
Hi,
I'm trying to use two different dimensions as alternate filters for the same bubble chart.
e.g. 1st scenario : "Type" filter selected which has categories like Type 1, Type 2 and Type 3
The chart shows segregation of data by "Type" and shows Type 1, Type 2 and Type 3 in the legend.
2nd scenario: " Status" Filter selected which has categories like "New", "In Progress" and " Close"
The same chart would show the segregation of data by "Status" and should show New, In Progress and Close in the legend.
Please advise.
- Mark as New
- Bookmark
- Subscribe
- Mute
- Subscribe to RSS Feed
- Permalink
- Report Inappropriate Content
Hello,
Do you trying something like this?

In script...
LOAD * INLINE [
Type, Status, Value
Type1, New,40
Type2, Close,50
Type3, In Progress,60
Type4, Close,20
Type5, In Progress,30
Type6, New,100
];
I have used a Grid chart, 1. Dimensions: status, Type. 2.Expression =Value
Other properties are default.
- Mark as New
- Bookmark
- Subscribe
- Mute
- Subscribe to RSS Feed
- Permalink
- Report Inappropriate Content
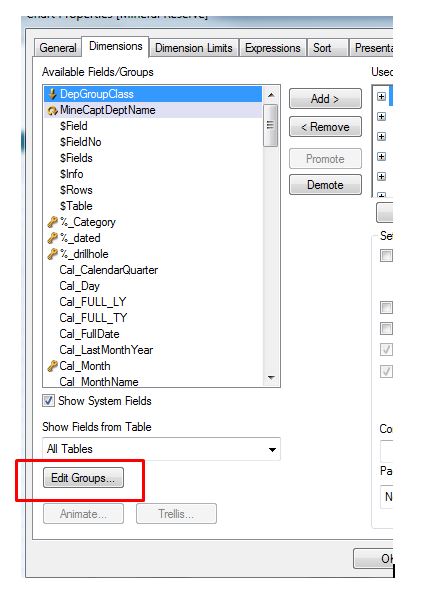
Have a look at Cyclic Groups.
You can access this from the Edit Groups button on the Chart Dimensions sheet.
- Mark as New
- Bookmark
- Subscribe
- Mute
- Subscribe to RSS Feed
- Permalink
- Report Inappropriate Content
There is a video on Cyclic & Drill Down Groups here Creating Cycle and Drill Groups