Unlock a world of possibilities! Login now and discover the exclusive benefits awaiting you.
- Qlik Community
- :
- All Forums
- :
- QlikView App Dev
- :
- Re: Using Qlikview with imported data to change ba...
- Subscribe to RSS Feed
- Mark Topic as New
- Mark Topic as Read
- Float this Topic for Current User
- Bookmark
- Subscribe
- Mute
- Printer Friendly Page
- Mark as New
- Bookmark
- Subscribe
- Mute
- Subscribe to RSS Feed
- Permalink
- Report Inappropriate Content
Using Qlikview with imported data to change bar graph
Hello,
I am trying to use Qlikview to display data imported from SQL as a bar graph. I want to make it so that if the bar graph value is below 2, the bar will turn red in color. Also, if the bar value is above 15, it will be black in color. Anything in between I would like to be green.
In C# code, something along the lines of this:
If (QuantityOnHand < 2)
{
Turn color red
}
Else If (QuantityOnHand > 15)
{
Turn color black
}
Else
{
Turn color green
}
Can somebody please direct me on the best way to accomplish this in Qlikview?
I would greatly appreciate any help.
- Mark as New
- Bookmark
- Subscribe
- Mute
- Subscribe to RSS Feed
- Permalink
- Report Inappropriate Content
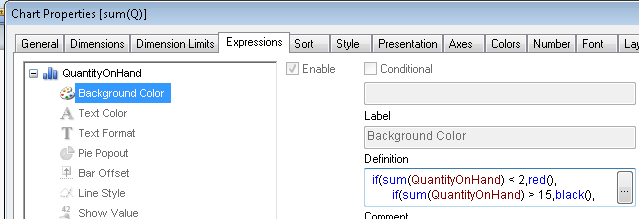
The image below shows where to put the code.
The code is:
if(sum(QuantityOnHand) < 2,red(),
if(sum(QuantityOnHand) > 15,black(),
green()
)
)
For more precise colors, replace the color functions with rgb(###,###,###)
- Mark as New
- Bookmark
- Subscribe
- Mute
- Subscribe to RSS Feed
- Permalink
- Report Inappropriate Content
This helped a lot, thank you. I am still having some problems with this, however. If I have a bar that goes up to 22 and I would like the first 2 sections to be red, sections 2-15 to be green, and 15-22 to be black, what would be the best way to accomplish this?
Thank you for all your help.