Unlock a world of possibilities! Login now and discover the exclusive benefits awaiting you.
- Qlik Community
- :
- All Forums
- :
- QlikView App Dev
- :
- Re: Visual Cues Query
- Subscribe to RSS Feed
- Mark Topic as New
- Mark Topic as Read
- Float this Topic for Current User
- Bookmark
- Subscribe
- Mute
- Printer Friendly Page
- Mark as New
- Bookmark
- Subscribe
- Mute
- Subscribe to RSS Feed
- Permalink
- Report Inappropriate Content
Visual Cues Query
Hi
I want to set a RAG status for few thresholds using Visual Cues, could someone point me in the right direction. I am sure this will be simple, just can't find it on the forum.
My expression is a percentage and I need it to show as below:
Less than 80% = Red
80% - 94.9% = Yellow
95% - 99.9% = Green
100% - 104.9% = Yellow
More than or equal to 105% = Red
Any ideas??
Thanks
Phil
- Mark as New
- Bookmark
- Subscribe
- Mute
- Subscribe to RSS Feed
- Permalink
- Report Inappropriate Content
Hi Phil,
the sample file "Data Visualization" has a Speedometer example with RAG (KPI Tab>>Presentation property>>Segments)
- Mark as New
- Bookmark
- Subscribe
- Mute
- Subscribe to RSS Feed
- Permalink
- Report Inappropriate Content
While define visual cues , click on expression window and use if condition like this
if (growth > 80 and growth < 94.9 , Yellow(),if( growth > and < , Green() , If(
This should solve your problem
Vikas
If the issue is solved please mark the answer with Accept as Solution & like it.
If you want to go quickly, go alone. If you want to go far, go together.
- Mark as New
- Bookmark
- Subscribe
- Mute
- Subscribe to RSS Feed
- Permalink
- Report Inappropriate Content
pfa image
If the issue is solved please mark the answer with Accept as Solution & like it.
If you want to go quickly, go alone. If you want to go far, go together.
- Mark as New
- Bookmark
- Subscribe
- Mute
- Subscribe to RSS Feed
- Permalink
- Report Inappropriate Content
Vikkas
Your script works but it returns the text of the colour ('RGB, 255,255,0') text, not the percentage and the colour.
Please see below :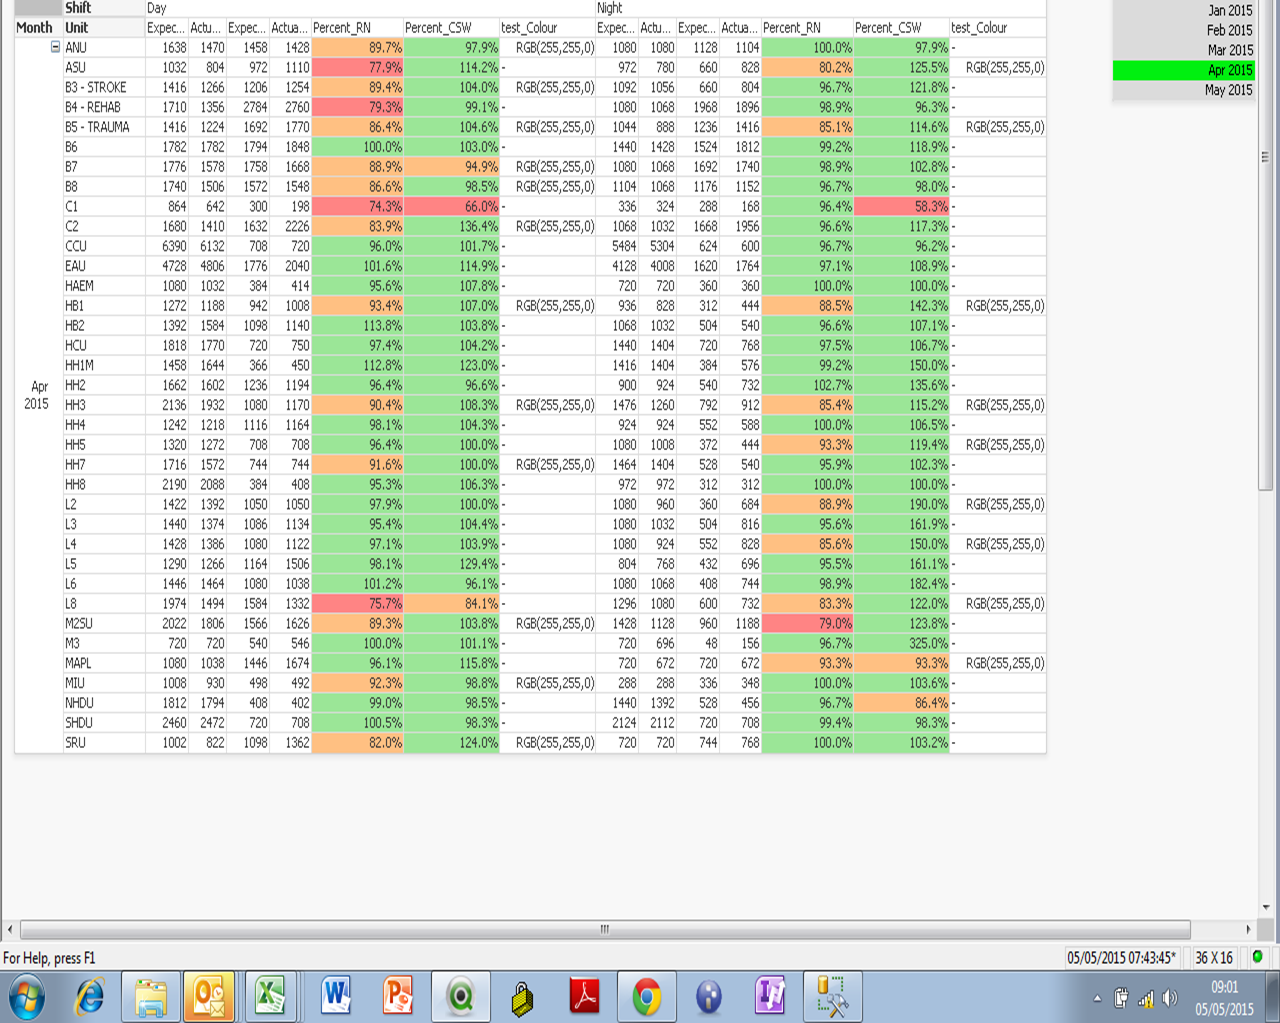
- Mark as New
- Bookmark
- Subscribe
- Mute
- Subscribe to RSS Feed
- Permalink
- Report Inappropriate Content
Please Find sample Give in Text Colour.
Vikas
If the issue is solved please mark the answer with Accept as Solution & like it.
If you want to go quickly, go alone. If you want to go far, go together.