Unlock a world of possibilities! Login now and discover the exclusive benefits awaiting you.
- Qlik Community
- :
- All Forums
- :
- QlikView App Dev
- :
- can't find the correct filter with Set Analysis
- Subscribe to RSS Feed
- Mark Topic as New
- Mark Topic as Read
- Float this Topic for Current User
- Bookmark
- Subscribe
- Mute
- Printer Friendly Page
- Mark as New
- Bookmark
- Subscribe
- Mute
- Subscribe to RSS Feed
- Permalink
- Report Inappropriate Content
can't find the correct filter with Set Analysis
First time for me here in the Community. I hope some one can help.
Situation:
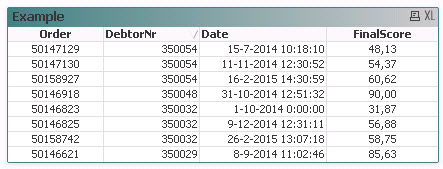
We are doing inspections in stores. For different objects they get a score. After finishing the inspection each store get a final score. After a while there will be more inspections in de database for each store, so also more final scores for each store.
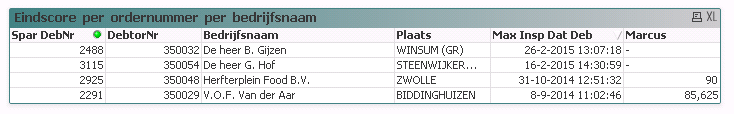
Te image is showing the Order, (Inspection)date, Store and Final Score.
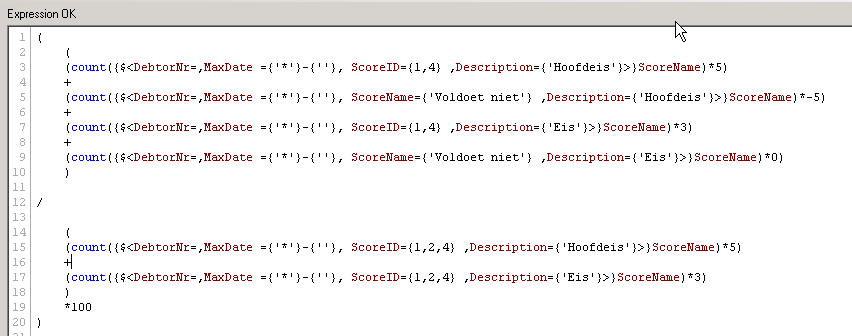
Calculating the final score is depending on the score of the objects. I use next formule:
(
(
(count({$<ScoreID={1,4} ,Description={'Hoofdeis'}>}ScoreName)*5)
+
(count({$<ScoreName={'Voldoet niet'} ,Description={'Hoofdeis'}>}ScoreName)*-5)
+
(count({$<ScoreID={1,4} ,Description={'Eis'}>}ScoreName)*3)
+
(count({$<ScoreName={'Voldoet niet'} ,Description={'Eis'}>}ScoreName)*0)
)
/
(
(count({$<ScoreID={1,2,4} ,Description={'Hoofdeis'}>}ScoreName)*5)
+
(count({$<ScoreID={1,2,4} ,Description={'Eis'}>}ScoreName)*3)
)
*100
)
So far so good...
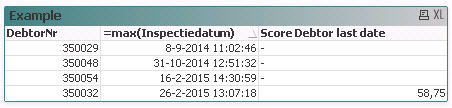
The next table I want to show for each store the Final Score of the last inspectiondate. So when we have done 3 inspections in the same store, I only want to show a record with the last inspection an the final score of that inspection of that store
Problem in this table is that its showing only the final score of (really) the last inspectiondate in the whole selection and I can't resolve it!
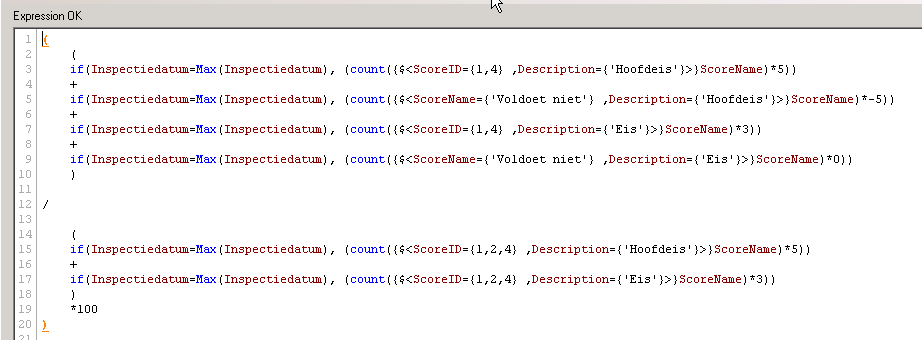
For the final score I use know the next calculating:
(
(
(count({$<Inspectiedatum={"$(=Max(Inspectiedatum))"}, DebtorNr=, ScoreID={1,4} ,Description={'Hoofdeis'}>}ScoreName)*5)
+
(count({$<Inspectiedatum={"$(=Max(Inspectiedatum))"}, DebtorNr=, ScoreName={'Voldoet niet'} ,Description={'Hoofdeis'}>}ScoreName)*-5)
+
(count({$<Inspectiedatum={"$(=Max(Inspectiedatum))"}, DebtorNr=, ScoreID={1,4} ,Description={'Eis'}>}ScoreName)*3)
+
(count({$<Inspectiedatum={"$(=Max(Inspectiedatum))"}, DebtorNr=, ScoreName={'Voldoet niet'} ,Description={'Eis'}>}ScoreName)*0)
)
/
(
(count({$<Inspectiedatum={"$(=Max(Inspectiedatum))"}, DebtorNr=, ScoreID={1,2,4} ,Description={'Hoofdeis'}>}ScoreName)*5)
+
(count({$<Inspectiedatum={"$(=Max(Inspectiedatum))"}, DebtorNr=, ScoreID={1,2,4} ,Description={'Eis'}>}ScoreName)*3)
)
*100
)
The results I want to see looks so simple to build, but I am doing something wrong!
Who can help me to resolve my problem? Thanks..
- « Previous Replies
-
- 1
- 2
- Next Replies »
Accepted Solutions
- Mark as New
- Bookmark
- Subscribe
- Mute
- Subscribe to RSS Feed
- Permalink
- Report Inappropriate Content
Yes, I think you can use this expression:
FirstSortedValue(aggr(
(
(
(count({$<ScoreID={1,4} ,Description={'Hoofdeis'}>}ScoreName)*5)
+
(count({$<ScoreName={'Voldoet niet'} ,Description={'Hoofdeis'}>}ScoreName)*-5)
+
(count({$<ScoreID={1,4} ,Description={'Eis'}>}ScoreName)*3)
+
(count({$<ScoreName={'Voldoet niet'} ,Description={'Eis'}>}ScoreName)*0)
)
/
(
(count({$< ScoreID={1,2,4} ,Description={'Hoofdeis'}>}ScoreName)*5)
+
(count({$<ScoreID={1,2,4} ,Description={'Eis'}>}ScoreName)*3)
)
*100
)
,DebtorNr,Inspectiedatum), -aggr(Inspectiedatum,Inspectiedatum))
talk is cheap, supply exceeds demand
- Mark as New
- Bookmark
- Subscribe
- Mute
- Subscribe to RSS Feed
- Permalink
- Report Inappropriate Content
This couldn't work in this way. You created with $(=Max(Inspectiedatum)) an adhoc-variable which could only have one value for the whole chart. Such variables will be calculated first and then applied to all rows.
It's difficult to say how it could be solved but I would tend to read the max-date within the script, maybe:
Load store, max(Inspectiedatum) as maxDate Resident xyz group by store;
and use this within the expression or as a dimension-filter.
As an alternatively you could split tthe expression in a if-part and the set analysis part, like:
if(Inspectiedatum=Max(Inspectiedatum), (count({$<ScoreID={1,4} ,Description={'Hoofdeis'}>}ScoreName)*5) +++
- Marcus
- Mark as New
- Bookmark
- Subscribe
- Mute
- Subscribe to RSS Feed
- Permalink
- Report Inappropriate Content
Try: FirstSortedValue(aggr( ...original_expression_here... ,DebtorNr,Inspectiedatum), -Inspectiedatum))
talk is cheap, supply exceeds demand
- Mark as New
- Bookmark
- Subscribe
- Mute
- Subscribe to RSS Feed
- Permalink
- Report Inappropriate Content
Hi Gysbert,
Thanks for your input. I tried to understand your comment and make the expression this way:
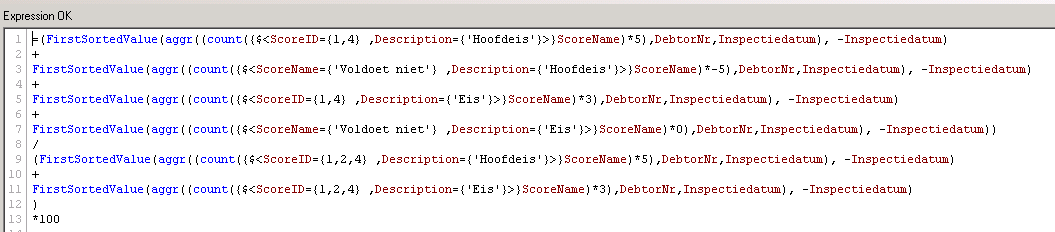
I am sorry when I understood it in the wrong way. There where no results in the table. 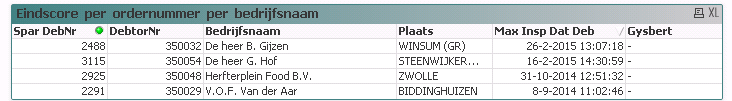
I think the problem is that when I use the field 'inspectiedatum' that there is no answer in the record what means that I can't compare it.
When I interpretated you expression wrong I really wanted to know what way it has to be.
Thanks anyway...
- Mark as New
- Bookmark
- Subscribe
- Mute
- Subscribe to RSS Feed
- Permalink
- Report Inappropriate Content
That's not what I meant. Can you upload a qvw document with data? See this document for instructions: Preparing examples for Upload - Reduction and Data Scrambling
talk is cheap, supply exceeds demand
- Mark as New
- Bookmark
- Subscribe
- Mute
- Subscribe to RSS Feed
- Permalink
- Report Inappropriate Content
Use instead Expression1 + Expression2 ... which will return Null if any from the expressions isn't valid rangesum(Expression1, Expression2, ...).
- Marcus
- Mark as New
- Bookmark
- Subscribe
- Mute
- Subscribe to RSS Feed
- Permalink
- Report Inappropriate Content
Hi Marcus,
I understand what you mean with "could only have one value for the whole chart" That was making my problem clear. I tried the alternatively expression:
The results:
It was clear for me that the records without result could not compare the 'inspectiedatum' (more then 1 inspection) with the 'Max(Inspectiedatum)' The records with results where the records with 1 inspectiondate.
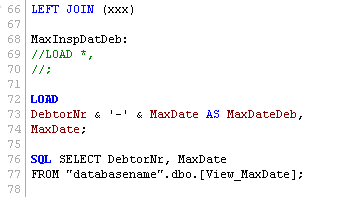
So I tried to understand your description about the script. I was not sure about the command 'Resident' but finaly I had a new field in the same Table named 'MaxDate' filled with the data of te last inspectiondate of the store. The data was correct, but also in the table it was showing again the AVG results of each store and not the result of the last inspectiondate.
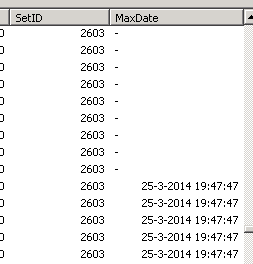
Finaly it gaves me the idea that I needed a new field in the same table which only showes the last date when it of the store when it was really the last date of inspection. So I combined a field STORE (DebtorNr) with the last inspection date:
The results in the table was showing only the MaxDate when it was a record from the MaxDate. (It also could be a Y(es) or N(o))
In the expression I used the field 'MaxDate' and filtered on ISNULL records or "" records
With the results in te Table:
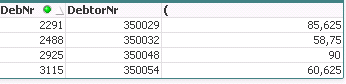
Of course I want to know if there is a much more easier way.... but finaly I have the good results...
Thanks for your input....
- Mark as New
- Bookmark
- Subscribe
- Mute
- Subscribe to RSS Feed
- Permalink
- Report Inappropriate Content
Thanks for the instructions for uploading a qvw! very usefull, also for demonstrations 
I will upload the qvw.
- Mark as New
- Bookmark
- Subscribe
- Mute
- Subscribe to RSS Feed
- Permalink
- Report Inappropriate Content
I am sorry Marcus that I don't understand exactly your explanation. I understand I have to compare 2 expressions, but I don't know the expressions.
- Mark as New
- Bookmark
- Subscribe
- Mute
- Subscribe to RSS Feed
- Permalink
- Report Inappropriate Content
I meant you adds several expressions like:
...
(count({$<ScoreID={1,4} ,Description={'Hoofdeis'}>}ScoreName)*5)
+
(count({$<ScoreName={'Voldoet niet'} ,Description={'Hoofdeis'}>}ScoreName)*-5)
...
but if only one from these expressions had a invalid result the whole expression will be NULL. If you used a rangesum() or you wrapped your expression in an alt(Expression, NumericDefaultValue) function you will be always return a numeric result:
rangesum(
(count({$<ScoreID={1,4} ,Description={'Hoofdeis'}>}ScoreName)*5),
(count({$<ScoreName={'Voldoet niet'} ,Description={'Hoofdeis'}>}ScoreName)*-5),
....)
- Marcus
- « Previous Replies
-
- 1
- 2
- Next Replies »