Unlock a world of possibilities! Login now and discover the exclusive benefits awaiting you.
- Qlik Community
- :
- All Forums
- :
- QlikView App Dev
- :
- Re: chart should change with filters
- Subscribe to RSS Feed
- Mark Topic as New
- Mark Topic as Read
- Float this Topic for Current User
- Bookmark
- Subscribe
- Mute
- Printer Friendly Page
- Mark as New
- Bookmark
- Subscribe
- Mute
- Subscribe to RSS Feed
- Permalink
- Report Inappropriate Content
chart should change with filters
Hello guys
well what i am thinking in that i feel i should had get output what i am expecteing but its not happening .
suppose i have got the table like this
table1: table2:
places amount category location places
dadar 200 smelting mumbai dadar
dadar 100 mining mumbai malad
malad 100 smelting mumbai goregoan
malad 50 mining rajasthan udaipur
goregoan 150 smelting rajasthan jaipur
uadipur 100 smelting
jaipur 150 mining .......
NOTE:category(smelting ,mining) two different bar charts
BY default i am showing all the smelting in one chart and mining in one chart irrespective of the selection..which looks like this
table:
category amount
smelting 550(sum(dadar+malad+goregoan+uadipur)
mining 300(sum(dadar+malad+jaipure)
what client requirement is i need to show to filters 1.location
2.place
if he select only location(mumbai) from the drop down without choosing place filter then
TABLE:
category AMOUNT
smelting 450(sum(dadar+malad+goregoan))
mining 150
and if he go farther and select place also from the drop down then in the same bar chart it should like this
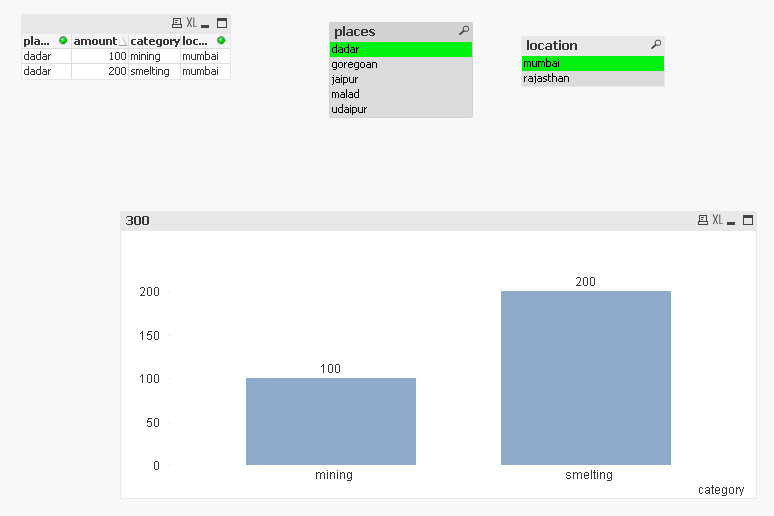
suppose if he select (location :mumbai, place:dadar)
the chart should show this:
category amount
smelting 200
my expression what i writen is this:
sum({<category={'smelting'},location={"*"},place={"*"}>}amount)....
sum({<category={'mining'},location={"*"},place={"*"}>}amount)....
but its not working in this way any suggestions please
thanks
naveen
- Mark as New
- Bookmark
- Subscribe
- Mute
- Subscribe to RSS Feed
- Permalink
- Report Inappropriate Content
location={"*"} means all possible locations, so it ignores a selection in this field, same for place. If you do not want to ignore these selections use
sum({<category={'smelting'}>}amount)
sum({<category={'mining'}>}amount)
- Mark as New
- Bookmark
- Subscribe
- Mute
- Subscribe to RSS Feed
- Permalink
- Report Inappropriate Content
What Piet Hein van der Stigchel has said should work + you don't need to expressions here. You can add category as dimension and Sum(amount) as expression and you are good to go.
- Mark as New
- Bookmark
- Subscribe
- Mute
- Subscribe to RSS Feed
- Permalink
- Report Inappropriate Content
Hello ,
Thanks for your reponse and itswas really helpfull ,i have one more query on it
see i am showing location field
places field as a dropbox
so if end user select a
location=mumbai then he should only able to see those places which are related to mumbai.wat i mean is
places=dadar (dropdown)
malad
goregoan (see should not see other place i men jaipur and uadipur which come under other location)
thanks
naveen
- Mark as New
- Bookmark
- Subscribe
- Mute
- Subscribe to RSS Feed
- Permalink
- Report Inappropriate Content
I think this is how it is working right now.