Unlock a world of possibilities! Login now and discover the exclusive benefits awaiting you.
- Qlik Community
- :
- All Forums
- :
- QlikView App Dev
- :
- crosstabs/pivot table newbie
- Subscribe to RSS Feed
- Mark Topic as New
- Mark Topic as Read
- Float this Topic for Current User
- Bookmark
- Subscribe
- Mute
- Printer Friendly Page
- Mark as New
- Bookmark
- Subscribe
- Mute
- Subscribe to RSS Feed
- Permalink
- Report Inappropriate Content
crosstabs/pivot table newbie
Hi - I'm a newbie in qlikview, and hope someone can offer suggestions:
A simplified example of my problem: I have 1000 widgets. Each widget is evaluated with 1, 2, or 3 different tests (say test A="appearance", test B="quality", test C="strength"). For a given test, a given widget can get a result of "Good", "Fair", or "Poor". The source data thus might look like this:
widget test result
1 A Good
1 B Fair
1 C Fair
2 C Good
2 A Poor
3 B Good
4 A Fair
4 B Fair
4 C Good
5 B Fair
etc.
Note that some widgets receive all 3 tests, some widgets receive only 2 tests, and some widgets receive only 1 test (the "1-test widgets" I don't care about, as will be evident below).
I would like to create the following pairwise comparison result tables of how widgets performed on pairs of tests: I would pick which two tests to compare from two different list boxes, each with an entry for test A, test B, and test C, to allow me to compare:
test A vs. test B
test A vs test C
test B vs test C
I want to create display the 3 resulting combinations of comparisons of counts of widgets (where which pair of comparisons is displayed is specified by which test is chosen for each of the two dimensions of the results table) . For example, test A vs test B comparison might yield the following table:
| Test B | |||
|---|---|---|---|
| Test A | Good | Fair | Poor |
Good | 25 | 12 | 7 |
| Fair | 10 | 8 | 13 |
| Poor | 8 | 6 | 7 |
Or without the graphics:
test B
test A Good Fair Poor
Good 25 12 7
Fair 10 8 13
Poor 8 6 7
Suggestions on the best way to produce these types of tables given my source data layout?
In reality, I have many thousands of widgets, and many different subsets of widgets that I might want to choose to evaluate - say those from factory X made in 2012, or those from factory X, Y, or Z made in 2010 or 2011. I would plan to specify the exact subset of widgets to be evaluated by choosing from a list box of "factories" and list box of "years". I also have about 25 different tests (rather than just test A, test B, and test C), and again would choose which two tests I wanted to compare using 2 list boxes. So in fact I have many combinations of different 3 by 3 tables of comparisons I'd like to be able to generate on the fly based on selections of two classes of parameters: which widgets (subset of the 1000 widgets), and which two tests to compare.(value for each dimension of the resulting table).
Thanks for any insights/thoughts/suggestions!
Accepted Solutions
- Mark as New
- Bookmark
- Subscribe
- Mute
- Subscribe to RSS Feed
- Permalink
- Report Inappropriate Content
Yes you are right. One row per widget and one column per test.
You can achieve it either through dynamic SQL in database or dynamic Load statement in Qlikview as demonstrated.
It doesn’t really matter for our final solution.
Regards,
Kalpesh
- Mark as New
- Bookmark
- Subscribe
- Mute
- Subscribe to RSS Feed
- Permalink
- Report Inappropriate Content
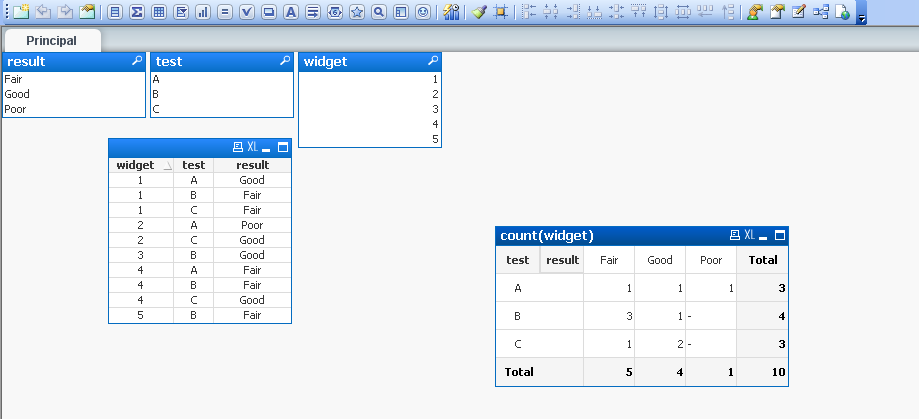
This is you need?
- Mark as New
- Bookmark
- Subscribe
- Mute
- Subscribe to RSS Feed
- Permalink
- Report Inappropriate Content
No, that's not quite right. In your result table you have test specification (A, B, or C) down the first column, reporting. What I need is Fair, Good, Poor for each row heading (indicating results for say, test A) , and also Fair, Good, Poor for each column heading (indicating results for, say, test B). I need to be able to specify which two tests are to be compared in the resulting table (here say test A and test B).
If indeed test A and test B are chosen to be compared, the resulting table given the little dataset you generated would be based on only two widgets (since test A and test B were both performed on only two widgets), widget 1 and widget 4:
test B
test A Fair Good Poor
Fair 1 0 0
Good 1 0 0
Poor 0 0 0
Thanks for any ideas.
- Mark as New
- Bookmark
- Subscribe
- Mute
- Subscribe to RSS Feed
- Permalink
- Report Inappropriate Content
Here is the sample approach.
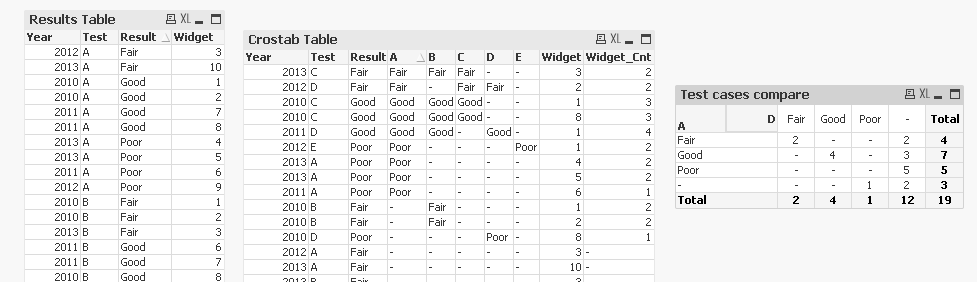
Though I manage to get the output in 3x3 cross tab as you mentioned, but I guess my data is messed up along with logical groupings and aggregations.
However, the key part of the solution lies in dynamically creating Tests columns e.g. Test-A, Test-B and so on depending on number 'Tests' available in data. Then, 'Result' values (Good, Fair, Poor etc..) are distributed in these columns.
So now we have each 'Test' with its 'Result' in a separate column along with the dimensions. Finally, we take a pivot chart and define one 'Tests' as dimension (in the row), and other 'Test' as attribute(in the column) while aggregating widget count.
I haven't got the numbers right in the chart, but if you try with real data it might be more easy to fix.
Warm Regards,
Kalpesh
- Mark as New
- Bookmark
- Subscribe
- Mute
- Subscribe to RSS Feed
- Permalink
- Report Inappropriate Content
Thanks for your input and suggestions. This will take me a little while to digest, not being particularly adept at intricacies of the Load statements, but it looks like this may be a workable idea.
My assumption from my understanding of your suggestion is that you believe I need to "preprocess" the data, transforming it to get it in a layout with 1 row per widget, with a designated column for each potential test. Given my lack of knowledge of QlikView load statements, and my greater familiarity with SQL, I think I would try to do that in SQL prior to bringing the datatable into QlikView.
Am I correct in my assumption of a needed data table layout change?
Thanks again for your help
- Mark as New
- Bookmark
- Subscribe
- Mute
- Subscribe to RSS Feed
- Permalink
- Report Inappropriate Content
Yes you are right. One row per widget and one column per test.
You can achieve it either through dynamic SQL in database or dynamic Load statement in Qlikview as demonstrated.
It doesn’t really matter for our final solution.
Regards,
Kalpesh
- Mark as New
- Bookmark
- Subscribe
- Mute
- Subscribe to RSS Feed
- Permalink
- Report Inappropriate Content
Hi, I have a little similar problem, see my post :
http://community.qlik.com/message/686576#686576
As for your question, if you model your data with this sql it is pretty straight forward to get your crosstable right:
select DimA.widget, DimA.result as ResultDim_1, DimB.result as ResultDim_2, 1 as DimCounter
from TestTable DimA inner join TestTable DimB
where DimA.widget = DimB.widget and DimA.test <> DimB.test
In my post there is an app with the solution.