Unlock a world of possibilities! Login now and discover the exclusive benefits awaiting you.
- Qlik Community
- :
- All Forums
- :
- QlikView App Dev
- :
- Re: how to pass variables user entered into bookma...
- Subscribe to RSS Feed
- Mark Topic as New
- Mark Topic as Read
- Float this Topic for Current User
- Bookmark
- Subscribe
- Mute
- Printer Friendly Page
- Mark as New
- Bookmark
- Subscribe
- Mute
- Subscribe to RSS Feed
- Permalink
- Report Inappropriate Content
how to pass variables user entered into bookmarks
Hello,
I tried a lot different ways to pass the variables user entered into bookmarks so that my line chart can only show the user selected market performance instead of the entire market performance.
I created an input box and also a variable related to it and right now whatever user entered can be passed to the variable. But it doesn't relate to line chart even I created a book mark and check the box "include input fields" and set analysis in line chart using "=sum({BM01}OrderTotalInUSD)".
Is there any way that I can pass whatever user enters into bookmark and then being reflected into my line chart?
Thank you so much for your help!
Best Regards,
Gloria
- Mark as New
- Bookmark
- Subscribe
- Mute
- Subscribe to RSS Feed
- Permalink
- Report Inappropriate Content
Gloria,
f you open Document Properties - Variables, there is a check box "Include in Bookmarks"
Regards,
Michael
- Mark as New
- Bookmark
- Subscribe
- Mute
- Subscribe to RSS Feed
- Permalink
- Report Inappropriate Content
Hi Michael,
Thank you for the response. I have already check the box "include in bookmarks" in variables, but it still doesn't work. I am wondering how each bookmark recognize the variable passed to it. When I change the market (e.g. from Korea to Canada) in the input box, the line chart doesn't change accordingly.
My goal is to let the user enter 3 markets as they want and compare the total amount for each of the market they selected in line chart.
Could you please help me?
Thank you!
Best Regards,
Gloria
- Mark as New
- Bookmark
- Subscribe
- Mute
- Subscribe to RSS Feed
- Permalink
- Report Inappropriate Content
It would be easier to understand the problem if you could upload the app...
- Mark as New
- Bookmark
- Subscribe
- Mute
- Subscribe to RSS Feed
- Permalink
- Report Inappropriate Content
Hi Michael,
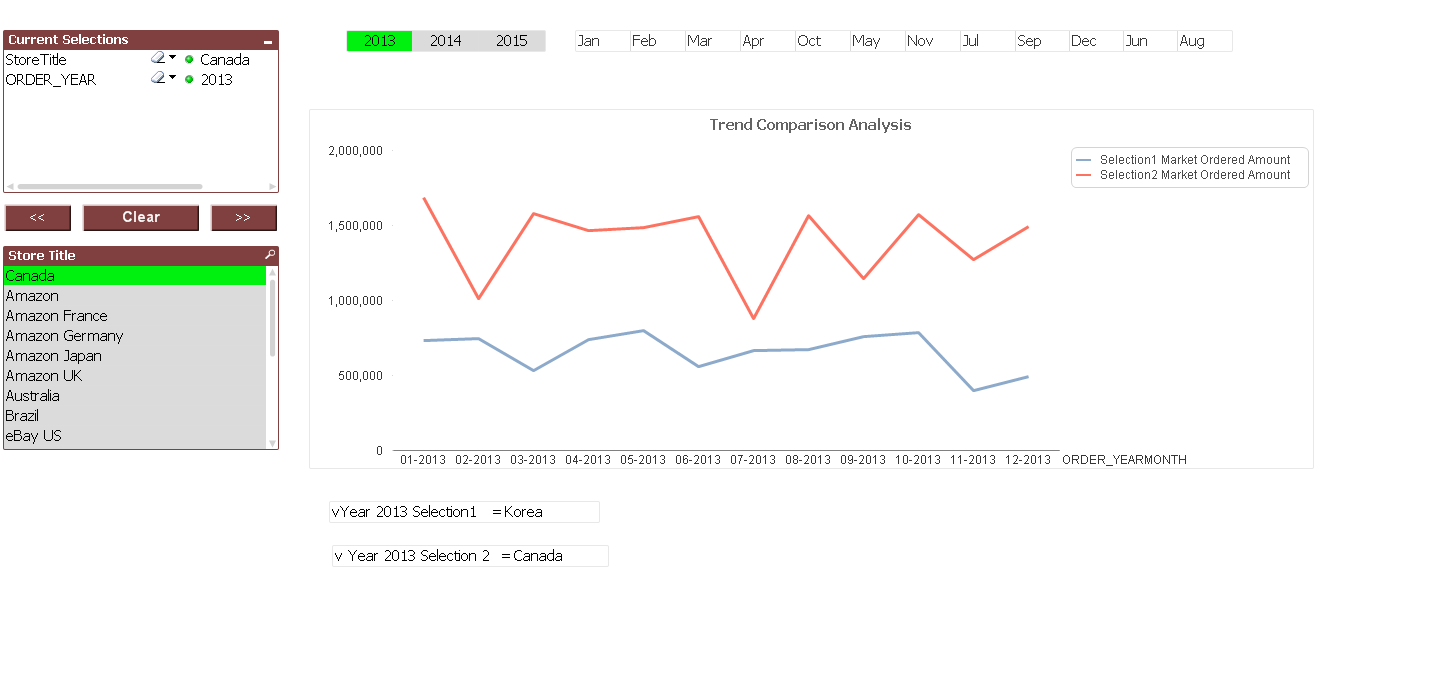
I don't think I can upload it because all the data is connected to the server. I just attach the screenshot and explain it better. Right now it works fine because I selected Korea and Canada when I added the bookmark, but I want to make the users selected whatever markets they are looking at and the line charts can change accordingly. For example, in the input box, I am hoping to let the user change the market ( for example, in selection 1 , change Korea to Australia) and the line chart will show the performance of Australia. The set analysis I am using in line chart is still =sum({BM01}OrderTotalInUSD.
The screenshot is like this:
Thank you so much!
Best Regards,
Gloria
- Mark as New
- Bookmark
- Subscribe
- Mute
- Subscribe to RSS Feed
- Permalink
- Report Inappropriate Content
If I understand your description correctly, the problem is exactly your usage of the bookmark in the expression. Bookmark "remembers" the selection of the countries hence ignores the current selections. Try expression
=sum(OrderTotalInUSD)
If I got it wrong, still need the application and a better explanation...
- Mark as New
- Bookmark
- Subscribe
- Mute
- Subscribe to RSS Feed
- Permalink
- Report Inappropriate Content
Hi Michael,
I think I didn't explain very clear. The whole point is to integrate user activities into this app. I selected Korea in Bookmark 1 and Canada in Bookmark2. That is why the line chart shows the performance of Korea and Canada. But in the input box, if the user put Australia in vYear 2013 Selection 1, "Australia" doesn't go into the book mark, meaning that the line chart still shows Korea's data when the users actually want to see the Australia's data.
If I only use sum(OrderTotalInUSD), the line chart only gave the trend of one market. However, I am looking to see the comparison of several market's performance across time.
Hope I explain clear. Is there anyway to fulfill this?
Thank you so much!
Best Regards,
Gloria
- Mark as New
- Bookmark
- Subscribe
- Mute
- Subscribe to RSS Feed
- Permalink
- Report Inappropriate Content
Gloria,
You still didn't explain it clear - apparently you need better understanding what is "variable", "field", "input box", "list box", what is "bookmark" and how it works in set analysis.
In short, if you created a bookmark for Korea, and use it in set analysis as you did - the result is always for Korea regardless selections. Similar for the second bookmark.
If you want to have a line for each market, there should be no bookmarks in set, but the market (store title?) should be a dimension of the chart.
I can't provide any additional help without application, sorry 
Regards,
Michael
- Mark as New
- Bookmark
- Subscribe
- Mute
- Subscribe to RSS Feed
- Permalink
- Report Inappropriate Content
Could someone let me know how do I achieve this in Qlik Sense ? Since it doesn't have document properties option.