Unlock a world of possibilities! Login now and discover the exclusive benefits awaiting you.
- Qlik Community
- :
- All Forums
- :
- QlikView App Dev
- :
- incorrect calculated summary in pivot chart
- Subscribe to RSS Feed
- Mark Topic as New
- Mark Topic as Read
- Float this Topic for Current User
- Bookmark
- Subscribe
- Mute
- Printer Friendly Page
- Mark as New
- Bookmark
- Subscribe
- Mute
- Subscribe to RSS Feed
- Permalink
- Report Inappropriate Content
incorrect calculated summary in pivot chart
HI Community,
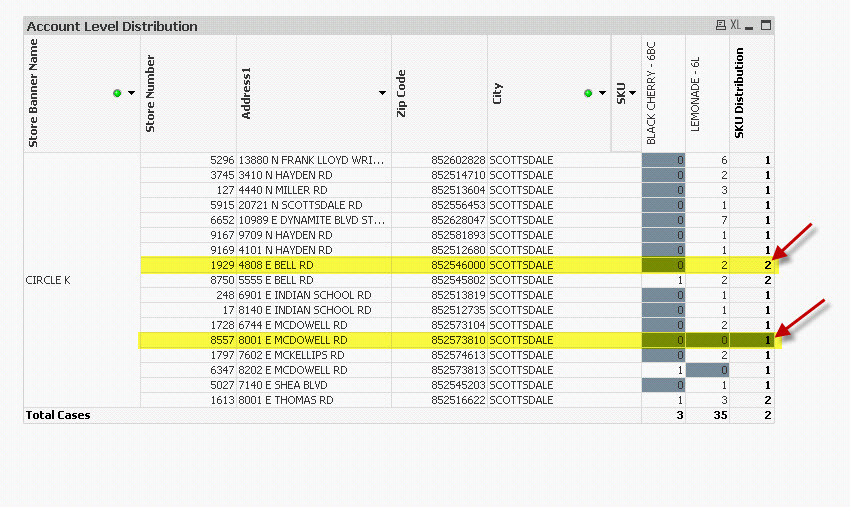
This post is further to post http://community.qlik.com/message/191543#191543 where I'm having difficulty with getting the proper count of skus/items on the summary rows on the far right of the pivot chart.
There is a row of data (address 4808 E Bell rd) that has only one product but is showing 2 for count of sku's.
There is also a row of data (address 8001 E Mcdowell rd) that has no products but is showing 1 for count of sku's.
Can someone offer some insight into why this happens?
I have also attached a sample qvw that also highlights this situation. thanks so much.
Accepted Solutions
- Mark as New
- Bookmark
- Subscribe
- Mute
- Subscribe to RSS Feed
- Permalink
- Report Inappropriate Content
I believe your problem is, that the expression for the total,
count({<SKU = {"=sum({$<Year={$(=Only(Year))}>} Depletion)>0"}>} distinct SKU)
, uses a set expression that will not be evaluated in the context of the line / store, but for the complete chart (like all set expressions do).
You select a set of SKU where the sum of Depletion is larger than zero for the selected year, in your example, that are both SKU, black cherry and lemonade.
Your total expression will count the SKU for a given line, if you got a record for those SKU, but regardless if the sum of depletion is larger than zero. The two lines that seem not to match your expectations do have records, 0 / 0 resp -1 / 1, with a sum of zero, but as said, that doesn't matter here anymore.
The other stores that seem to count the zero sum for black cherry correctly just don't have any records, so the count will be zero.
Ok, but how to correct for this?
You could use something like:
if (SecondaryDimensionality() >0,
sum({$<Year={$(=Only(Year))}>} Depletion)
,
sum(aggr(if(sum({$<Year={$(=Only(Year))}>} Depletion) >0, 1,0),[Store Number], SKU))
)
which will check the sum of depletion per line expression value (combination of Store number and SKU).
Another possibility might be to create a field in your Deletion_Fact table that combines Product_ID and %OutletKey and then create a set expression with the sum(...)>0 search string for that field.
Attached is my modified sample.
Regards,
Stefan