Unlock a world of possibilities! Login now and discover the exclusive benefits awaiting you.
- Qlik Community
- :
- All Forums
- :
- QlikView App Dev
- :
- Re: percentages on stacked chart
- Subscribe to RSS Feed
- Mark Topic as New
- Mark Topic as Read
- Float this Topic for Current User
- Bookmark
- Subscribe
- Mute
- Printer Friendly Page
- Mark as New
- Bookmark
- Subscribe
- Mute
- Subscribe to RSS Feed
- Permalink
- Report Inappropriate Content
percentages on stacked chart
Hi ,
i have a stacked bar chart, where i want to display percentages insread of values on the data points.
Total bar value is 100% and every color represents its contribution.
PLease find the attached picture.
- « Previous Replies
-
- 1
- 2
- Next Replies »
Accepted Solutions
- Mark as New
- Bookmark
- Subscribe
- Mute
- Subscribe to RSS Feed
- Permalink
- Report Inappropriate Content
For two expression you can do this:
Expression1:
Expression1/RangeSum(Expression1, Expression2)
Expression2:
Expression2/RangeSum(Expression1, Expression2)
Replace Expression1 and Expression2 with your existing Expressions in your chart.
- Mark as New
- Bookmark
- Subscribe
- Mute
- Subscribe to RSS Feed
- Permalink
- Report Inappropriate Content
Assuming this is what your current expression is -? Sum(Sales), try changing it to this:
Sum(Sales)/Sum(TOTAL <FirstDimensionHere> Sales)
- Mark as New
- Bookmark
- Subscribe
- Mute
- Subscribe to RSS Feed
- Permalink
- Report Inappropriate Content
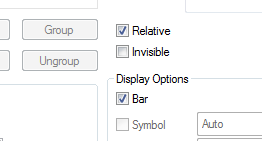
Did you try to check the relative in the expression?
- Mark as New
- Bookmark
- Subscribe
- Mute
- Subscribe to RSS Feed
- Permalink
- Report Inappropriate Content
Relative with two dimensions is probably going to calculate the percentage based on the total which probably won't work for Mark
- Mark as New
- Bookmark
- Subscribe
- Mute
- Subscribe to RSS Feed
- Permalink
- Report Inappropriate Content
I may not understand what exactly you mean, however, I just tested out a simple example with 2 dimensions and it is based out the total of first dimension when checking relative.(which i think it is your set analysis means)
- Mark as New
- Bookmark
- Subscribe
- Mute
- Subscribe to RSS Feed
- Permalink
- Report Inappropriate Content
See the difference between the two charts in the image below
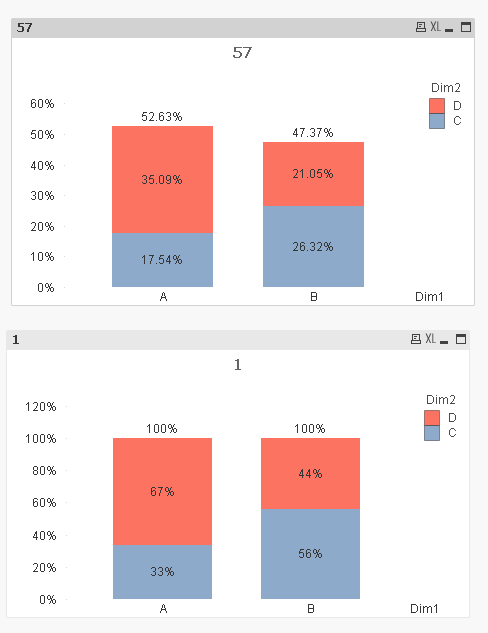
Top image is using Relative and the bottom one uses this expression -> =Sum(Value)/Sum(TOTAL <Dim1> Value)
Script used:
Table:
LOAD * Inline [
Dim1, Dim2, Value
A, C, 10
A, D, 20
B, C, 15
B, D, 12
];
- Mark as New
- Bookmark
- Subscribe
- Mute
- Subscribe to RSS Feed
- Permalink
- Report Inappropriate Content
Sunny,
Really Thanq verymuch for your time and patience brother.
In my application, the stacked chart is comprised of 2 expressions.
I think that's the reason.
Let me share the application please.
- Mark as New
- Bookmark
- Subscribe
- Mute
- Subscribe to RSS Feed
- Permalink
- Report Inappropriate Content
For two expression you can do this:
Expression1:
Expression1/RangeSum(Expression1, Expression2)
Expression2:
Expression2/RangeSum(Expression1, Expression2)
Replace Expression1 and Expression2 with your existing Expressions in your chart.
- Mark as New
- Bookmark
- Subscribe
- Mute
- Subscribe to RSS Feed
- Permalink
- Report Inappropriate Content
Thanq Sunny 
- Mark as New
- Bookmark
- Subscribe
- Mute
- Subscribe to RSS Feed
- Permalink
- Report Inappropriate Content
No problem at all Mark
- « Previous Replies
-
- 1
- 2
- Next Replies »