Unlock a world of possibilities! Login now and discover the exclusive benefits awaiting you.
- Qlik Community
- :
- All Forums
- :
- QlikView App Dev
- :
- Re: showing specific values of the whole dataset b...
- Subscribe to RSS Feed
- Mark Topic as New
- Mark Topic as Read
- Float this Topic for Current User
- Bookmark
- Subscribe
- Mute
- Printer Friendly Page
- Mark as New
- Bookmark
- Subscribe
- Mute
- Subscribe to RSS Feed
- Permalink
- Report Inappropriate Content
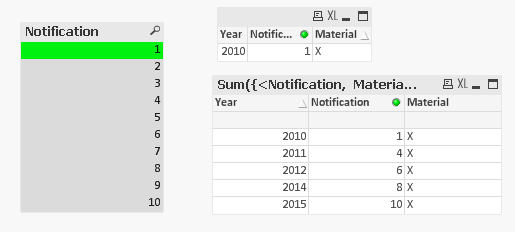
showing specific values of the whole dataset based on a selection
Hey all,
for our Quality Department I would like to establish the following analysis:
We have notifications that are linked to a materialnumber which is affected by some specific error. If a quality manager selects a specific notification, I would like him to see all the notifications where the linked materialnumber has also occured:
Using the table below, by selection notification 1, I would like qlikview to create a graph which shows the notifications 1,4,6,8 and 10 since they are all about the same material.
| Year | Notification | Material |
| 2010 | 1 | X |
| 2010 | 2 | Z |
| 2010 | 3 | Z |
| 2011 | 4 | X |
| 2011 | 5 | Z |
| 2012 | 6 | X |
| 2013 | 7 | Z |
| 2014 | 8 | X |
| 2014 | 9 | Z |
| 2015 | 10 | X |
Thank you for your efforts!
best,
Sebastian
- Mark as New
- Bookmark
- Subscribe
- Mute
- Subscribe to RSS Feed
- Permalink
- Report Inappropriate Content
Not Sure why u are taking Notification number as dimension when you could easily choose material to see all related Notifications.
- Mark as New
- Bookmark
- Subscribe
- Mute
- Subscribe to RSS Feed
- Permalink
- Report Inappropriate Content
Create variable on frontend vMaterial and put below expression
= Material
Select any notification
Now use below expression in chart
=sum({<Material={"$(=vMaterial)"},Notification=>}Amount)
- Mark as New
- Bookmark
- Subscribe
- Mute
- Subscribe to RSS Feed
- Permalink
- Report Inappropriate Content
The use case is, that an analyst examines one specific notification where the development of the material within this notification shall be shown over the dimension year/month as additional information.
- Mark as New
- Bookmark
- Subscribe
- Mute
- Subscribe to RSS Feed
- Permalink
- Report Inappropriate Content
You can use p() here. PFA
Exp used: Sum({<Notification, Material=P(Material)>}1)