Unlock a world of possibilities! Login now and discover the exclusive benefits awaiting you.
- Qlik Community
- :
- All Forums
- :
- QlikView Administration
- :
- Re: Is this app design too overwhelming for QlikVi...
- Subscribe to RSS Feed
- Mark Topic as New
- Mark Topic as Read
- Float this Topic for Current User
- Bookmark
- Subscribe
- Mute
- Printer Friendly Page
- Mark as New
- Bookmark
- Subscribe
- Mute
- Subscribe to RSS Feed
- Permalink
- Report Inappropriate Content
Is this app design too overwhelming for QlikView?
So what gives? How do I ensure our environment is optimally tuned and the app isn’t overwhelming?
The .QVW in question is 170mb on disk, when loaded into memory hits a peak working set of 12.8 GB RAM.
- [MONTH] - 3 distinct values
- [PRIMARY_ID] – 2 million distinct values
- [SECONDARY_ID] – 7,000 distinct values
- [ROLL_UP_FIELD] – the aggregated integer
UI visualizations have the following mechanics:
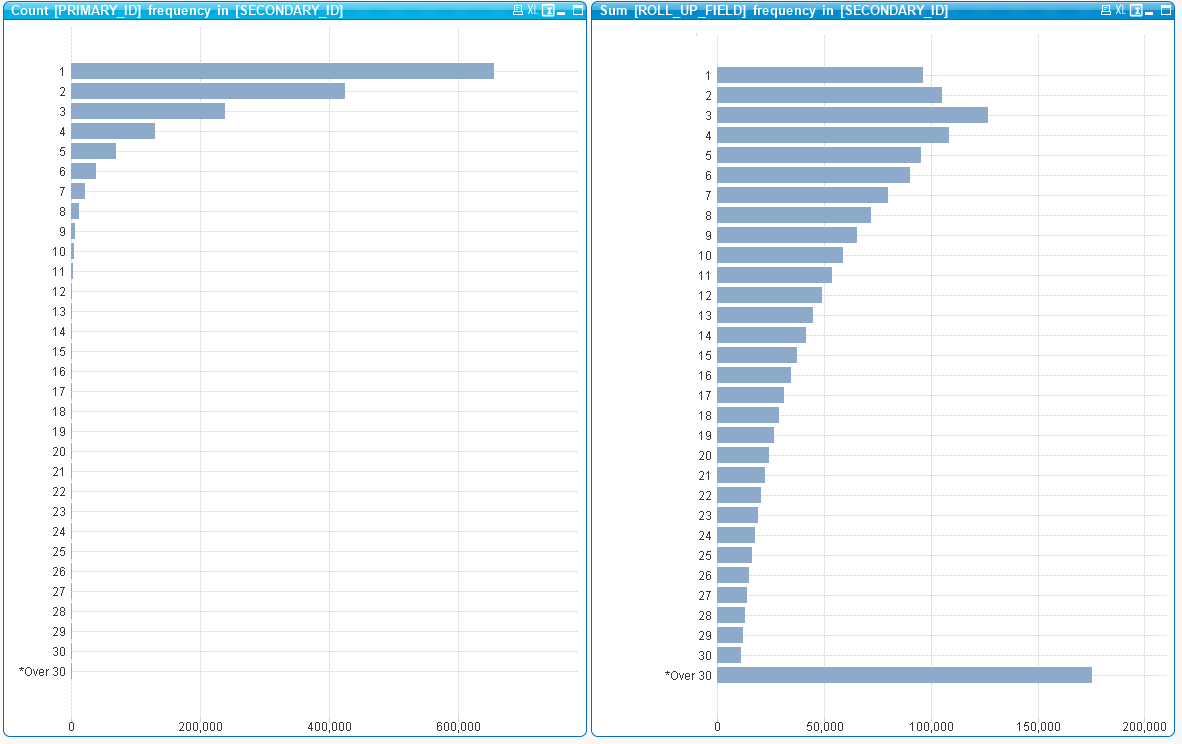
Chart #1 – Bar chart:
Calculated dimension:
- =Aggr(IF( Count(DISTINCT [SECONDARY_ID]) <31, Count(DISTINCT [SECONDARY_ID]),Dual('*Over 30 identified',999999)) ,[PRIMARY_ID])
Expression:
- =Count(DISTINCT [PRIMARY_ID])
Chart #2 – Bar chart:
Calculated dimension:
- =Aggr(IF( Sum([ROLL_UP_FIELD]) <31, Sum([ROLL_UP_FIELD],Dual('*Over 30 Roll-ups',999999)) ,[PRIMARY_ID])
Expression:
- =Count(DISTINCT [PRIMARY_ID])
In SQL terms these chart expressions ask the user-interface to whip up a pair of ad-hoc queries performing aggregation on 2 million distinct values: SELECT Count(DISTINCT [SECONDARY_ID]) AS Bucket,[PRIMARY_ID] GROUP BY [PRIMARY_ID]
About how much CPU / RAM would you expect this to take? What kind of response times are reasonable from the end-user experience?
While it hasn’t been optimized, this syntax seems relatively modest in terms of transformative logic. I can recall designs like this in the past that had no struggle fitting on 8GB RAM desktops able to return results relatively quick.
Appreciate your help Qlik community, thank you!
- Tags:
- qlikview_deployment
- Mark as New
- Bookmark
- Subscribe
- Mute
- Subscribe to RSS Feed
- Permalink
- Report Inappropriate Content
I could imagine that the following will be perform faster as a calculated dimension:
If(aggr(count(distinct [SECONDARY_ID]), [PRIMARY_ID]) < 31,
aggr(count(distinct [SECONDARY_ID]), [PRIMARY_ID]), Dual('*Over 30 identified',999999))
Another way might be just to pre-count this within the script and to create a simple 0/1 flag for it.
- Marcus
- Mark as New
- Bookmark
- Subscribe
- Mute
- Subscribe to RSS Feed
- Permalink
- Report Inappropriate Content
Hello Marcus,
Really appreciate your responses, thank you as always for your guidance.
There's been some research & findings about how repeating sub-sections of expression syntax verbatim (even preserving identical capitalization & white-space) will cause QlikView to recognize that a calculation has already been performed and can be retrieved via a cached result.
Is that what you're suggesting by reworking the expression to repeating the 'aggr(count(distinct [SECONDARY_ID]), [PRIMARY_ID])' phrase?
*so far it looks like this is working, and shaving off 20% of the calc time*
This can't really go to scripted pre-aggregation unless we give up the ability to recalculate based on user selections. If we knew which set of selectors were the "right answer" and just wanted to return an analyst result, that would be possible, but from the interactive design perspective, the tables should recalculate based on filtrations in the months & id fields.
I tried a 3rd method, and that was removing the IF condition for the high-end bucket, and applying the truncation line via the Dimensional Limits chart property.
Instead of IF (bucket > 30, 'the 30+ bucket'), I set Dimensional Limits to show only First 31 values, and include 'Show Others' in results. After a few unscientific tests, the processing saving is (marginally) the fastest of the 3 methods.
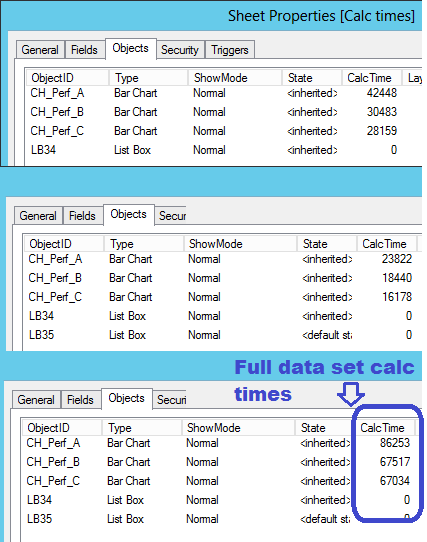
Against full data set:
CH_Perf_A - 86 seconds - Original method with Aggr() wrapping interior IF statement
CH_Perf_B - 67 seconds - IF() with condition & THEN clause repeating an Aggr() syntax
CH_Perf_C - 67 seconds - no IF() statement, solitary Aggr() in conjunction with Dimensional Limits
p.s. - part of me still recollects though based on past experience, that at these data volumes you could still get away with sloppy or inefficient expression syntax, and it would be no big deal. A narrow table of nothing but key identifiers could traverse on an ordinary server up till about 50 million distinct values before it started to require tuning considerations (with comparable queries. Naturally you could make convoluted things that tie up everything with lesser data volume). Now that threshold seems lowered. Like even showing a pure list box of just the millions of keys is effort.
- Mark as New
- Bookmark
- Subscribe
- Mute
- Subscribe to RSS Feed
- Permalink
- Report Inappropriate Content
Hi Evan,
I think there is no benefit in the direction of caching because this are only expression-parts and AFAIK only whole expressions will be hashed and therefore considered by the caching-logic. My suggestion was targeted to move the condition from inside of the aggr() to an outside-wrapping. This logic is by the common if-conditions like:
count(if(... compared to if(count( ...
usually quite faster and therefore I assumed it here, too.
Beside this I have the impression that the calculation is much slower as I would expect it. With the given specs (the bottleneck is the CPU clock because the creation of the virtual (aggr) table is only single-threaded) from your environment I would think the calculation shouldn't take much longer as 10 seconds, rather less. Therefore I could imagine that there is something not suitable within the VM settings whereby I'm not an expert on this area.
Another point which might make a difference is if those ID's are numerical or not. If not I would add ones (maybe with an autonumber) respectively replace the origin ones and checking the calculation-times again.
- Marcus
- Mark as New
- Bookmark
- Subscribe
- Mute
- Subscribe to RSS Feed
- Permalink
- Report Inappropriate Content
Marcus Sommer wrote:
Beside this I have the impression that the calculation is much slower as I would expect it. With the given specs (the bottleneck is the CPU clock because the creation of the virtual (aggr) table is only single-threaded) from your environment I would think the calculation shouldn't take much longer as 10 seconds, rather less. Therefore I could imagine that there is something not suitable within the VM settings- Marcus
YASSS!!! This!
I have as much query writing finesse as a light-bulb hammer (people say using self-deprecating commentary makes you likeable. I'm using that technique here. Is it working? Hopefully not too much. If this jocularity becomes market perception, I'm moving myself out of contention.).
But I'm certain, CERTAIN there were stretches in prior years, where Qlik would find these levels to be nbd. Integer keys in volumes < 10 million, Qlik does not break a sweat with single Aggr(Count(DISTINCT)).
This has me worried about perception becoming reality. If the VM gets to "recast" the reality of how long calculations take, and report artificially ballooned calculation times, this becomes market perception in our ongoing quest for foothold. "Yeah... we could've been done with this app a while ago.. but your vm server is a Gartner Quadrant lothario." 
Thank you Marcus!