Unlock a world of possibilities! Login now and discover the exclusive benefits awaiting you.
- Qlik Community
- :
- All Forums
- :
- QlikView Administration
- :
- Max Symbols in Charts option
- Subscribe to RSS Feed
- Mark Topic as New
- Mark Topic as Read
- Float this Topic for Current User
- Bookmark
- Subscribe
- Mute
- Printer Friendly Page
- Mark as New
- Bookmark
- Subscribe
- Mute
- Subscribe to RSS Feed
- Permalink
- Report Inappropriate Content
Max Symbols in Charts option
What is the use of the option "Max Symbols in Charts:"
- Tags:
- qlikview_deployment
Accepted Solutions
- Mark as New
- Bookmark
- Subscribe
- Mute
- Subscribe to RSS Feed
- Permalink
- Report Inappropriate Content
Hi,
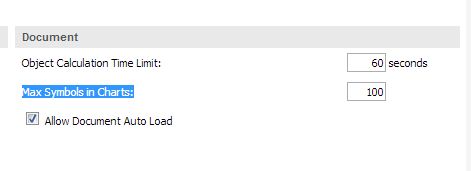
Here is what the documentation says:
"Max Symbols in
Charts
It is possible to specify an upper limit to how many data points that will be
displayed with symbols. The default number is 100. This feature is only useful
in line charts and combo charts, for expressions with both Line and Symbol
checked."
I have run some tests and here is a example to understand the behaviour of this option:
- Create a line chart
- On your expression, check option "Symbol"
- Set the value Max Symbols in Charts to 10
- If you chart contains less than 10 points, you will see the symbols. Otherwise, QlikView will just draw the line.
Regards,
Brice
- Mark as New
- Bookmark
- Subscribe
- Mute
- Subscribe to RSS Feed
- Permalink
- Report Inappropriate Content
I am looking for the option present in QVS setting,
- Mark as New
- Bookmark
- Subscribe
- Mute
- Subscribe to RSS Feed
- Permalink
- Report Inappropriate Content
Hi,
Here is what the documentation says:
"Max Symbols in
Charts
It is possible to specify an upper limit to how many data points that will be
displayed with symbols. The default number is 100. This feature is only useful
in line charts and combo charts, for expressions with both Line and Symbol
checked."
I have run some tests and here is a example to understand the behaviour of this option:
- Create a line chart
- On your expression, check option "Symbol"
- Set the value Max Symbols in Charts to 10
- If you chart contains less than 10 points, you will see the symbols. Otherwise, QlikView will just draw the line.
Regards,
Brice
- Mark as New
- Bookmark
- Subscribe
- Mute
- Subscribe to RSS Feed
- Permalink
- Report Inappropriate Content
I was talking about the option present in User preferences/Objects but I guess the behaviour is the same as the QVS setting.