Unlock a world of possibilities! Login now and discover the exclusive benefits awaiting you.
- Qlik Community
- :
- All Forums
- :
- QlikView Administration
- :
- Why text not Bold in charts
- Subscribe to RSS Feed
- Mark Topic as New
- Mark Topic as Read
- Float this Topic for Current User
- Bookmark
- Subscribe
- Mute
- Printer Friendly Page
- Mark as New
- Bookmark
- Subscribe
- Mute
- Subscribe to RSS Feed
- Permalink
- Report Inappropriate Content
Why text not Bold in charts
Hello Everyone,
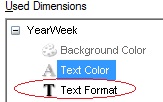
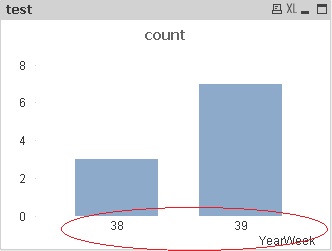
I'm wondering why the dimension text in bar chart does not change after setting the Text Format to Bold ='<B>', please see the screenshot below:
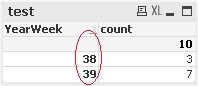
However, it works when I changed the bar chart to straigth table:
Could anyone please tell me why, and how to change them to bold font in the bar chart?
Many thanks...
- Tags:
- qlikview_deployment
Accepted Solutions
- Mark as New
- Bookmark
- Subscribe
- Mute
- Subscribe to RSS Feed
- Permalink
- Report Inappropriate Content
Hi,
Go to the chart properties> Axes Tab > Font and Choose BOLD.
The test will appear in Bold once you choose font in Y or X axis.
Thanks,
Advait.
https://www.linkedin.com/groups/6513382/
- Mark as New
- Bookmark
- Subscribe
- Mute
- Subscribe to RSS Feed
- Permalink
- Report Inappropriate Content
Change the dimension font under the Axes tab in the chart properties.
- Mark as New
- Bookmark
- Subscribe
- Mute
- Subscribe to RSS Feed
- Permalink
- Report Inappropriate Content
Hi,
Go to the chart properties> Axes Tab > Font and Choose BOLD.
The test will appear in Bold once you choose font in Y or X axis.
Thanks,
Advait.
https://www.linkedin.com/groups/6513382/
- Mark as New
- Bookmark
- Subscribe
- Mute
- Subscribe to RSS Feed
- Permalink
- Report Inappropriate Content
Hello Advait and Hohannes,
Your answers are both correct, it works. Thanks a lot for your help. 
- Mark as New
- Bookmark
- Subscribe
- Mute
- Subscribe to RSS Feed
- Permalink
- Report Inappropriate Content
Welcome, All my pleasure.
Thanks,
Advait
https://www.linkedin.com/groups/6513382/
- Mark as New
- Bookmark
- Subscribe
- Mute
- Subscribe to RSS Feed
- Permalink
- Report Inappropriate Content
And How to bold only one value?