Unlock a world of possibilities! Login now and discover the exclusive benefits awaiting you.
- Qlik Community
- :
- Forums
- :
- Analytics
- :
- QlikView
- :
- Documents
- :
- Files for creation of a Gantt chart
- Subscribe to RSS Feed
- Mark as New
- Mark as Read
- Bookmark
- Subscribe
- Printer Friendly Page
- Report Inappropriate Content
Files for creation of a Gantt chart
- Mark as New
- Bookmark
- Subscribe
- Mute
- Subscribe to RSS Feed
- Permalink
- Report Inappropriate Content
Files for creation of a Gantt chart
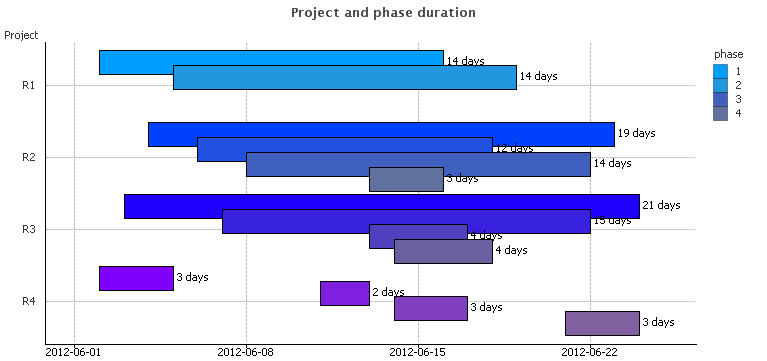
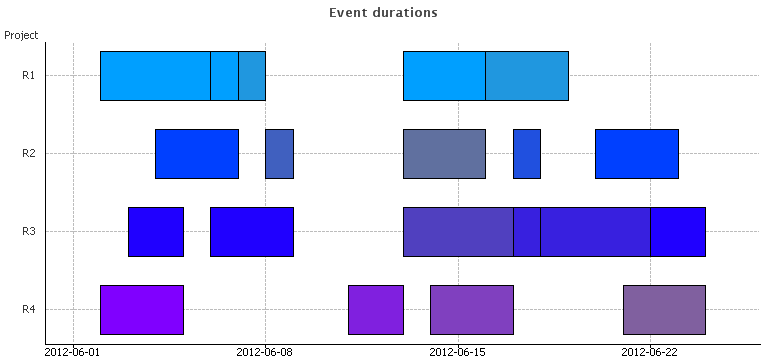
Have you ever wanted to create a Gantt chart in QlikView, only to find out that this chart type is not one of the pre-defined charts? Then you should be happy to learn that it is possible to create a Gantt chart and that it is not very difficult. See more on Recipe for Gantt chart.
- Mark as Read
- Mark as New
- Bookmark
- Permalink
- Report Inappropriate Content
Hello HIC,
Thanks for the example, i am using the same logic in my dashboard but one problem which I am unable to solve is the value shown when I hover my mouse over the bars.
As of now when I hover my mouse over the bars in the chart it shows a random date for the duration,i checked your attached example ,even there for the duration it shows some random date, could you please guide on how to fix this? ie to show numeric values under duration than some random date.
- Mark as Read
- Mark as New
- Bookmark
- Permalink
- Report Inappropriate Content
I used this option to change the mouse over labels
- Mark as Read
- Mark as New
- Bookmark
- Permalink
- Report Inappropriate Content
Great post HIC.
I created a YouTube video inspired by this post :
https://youtu.be/rcufeWouaNI?list=PL_MZdEB4lwqxxZLE7dOzIyGg_99qUzViz
Thanks
Mark
techstuffy.tv
- Mark as Read
- Mark as New
- Bookmark
- Permalink
- Report Inappropriate Content
Hi Henric,
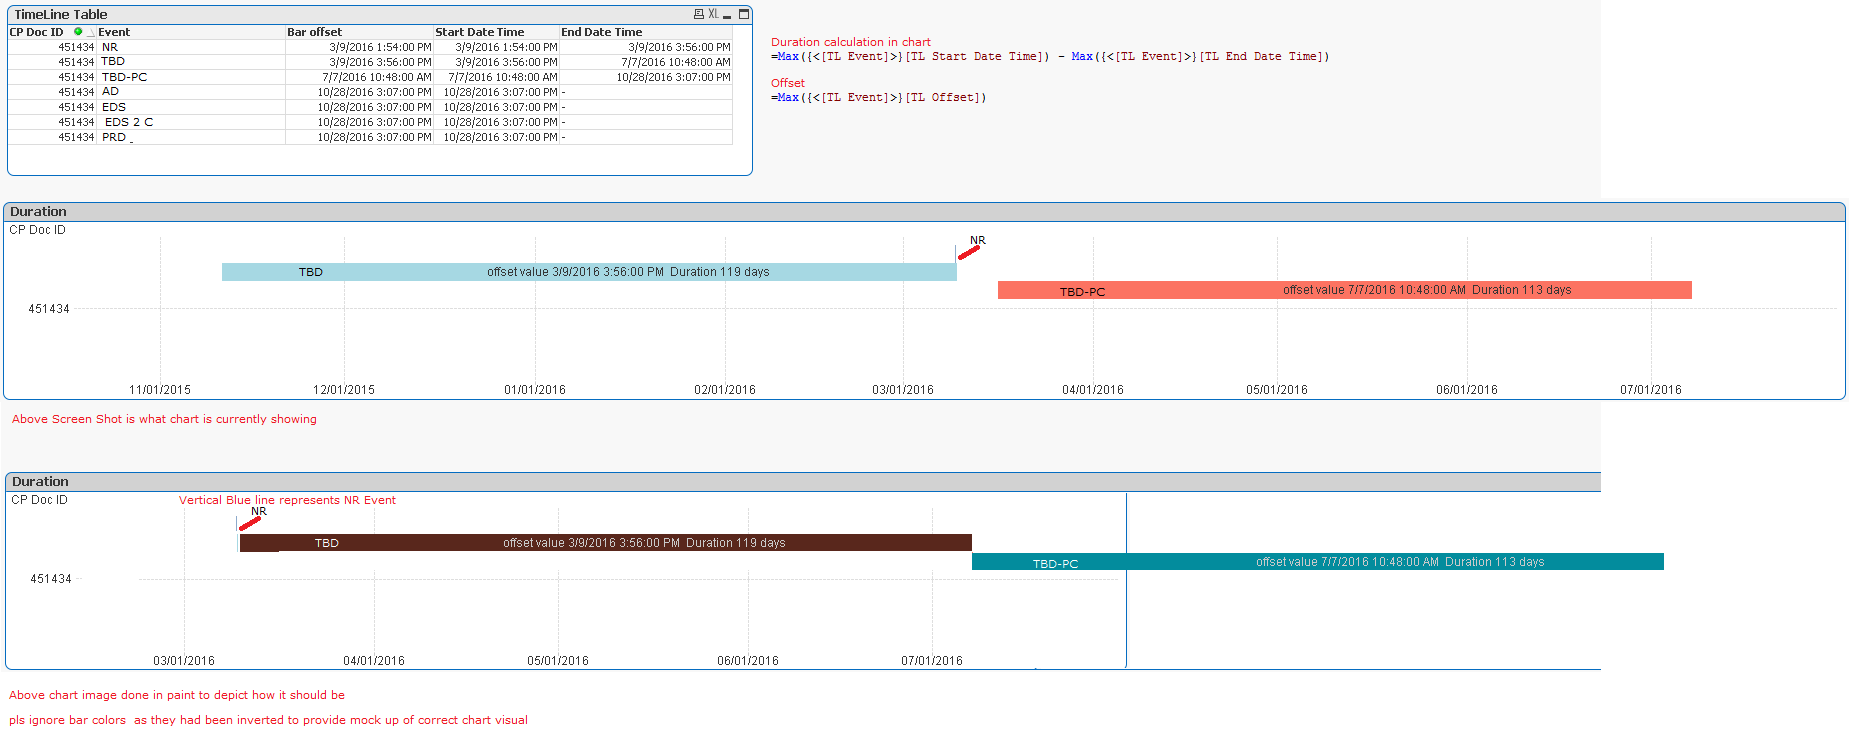
I found your example very useful in my situation but I've challenge in getting offset work correctly as can be seen in screen shot I've included.
I'll appreciate any help/guidance in the matter.
Thanks & Regards,
Vijay
- Mark as Read
- Mark as New
- Bookmark
- Permalink
- Report Inappropriate Content
It is difficult for me to assess what's wrong, since I don't know how you have defined your fields. However, I still think you have the wrong formulas. In principle, you should use
Duration: Max(End)-Min (Start)
Offset: Min(Start)
But you use
Duration: Max(Start)-Max(End)
Offset: Max([TL Offset])
which seems wrong to me...
HIC
- Mark as Read
- Mark as New
- Bookmark
- Permalink
- Report Inappropriate Content
Hi Henric,
Thanks for your reply. I was able to solve it as calculation Max(Start)-Max(End) resulted in negative value it was showing on left instead of right. Once I changed it to Max(End)-Max(Start) it worked fine. The reason for this is that End date time is after the start.
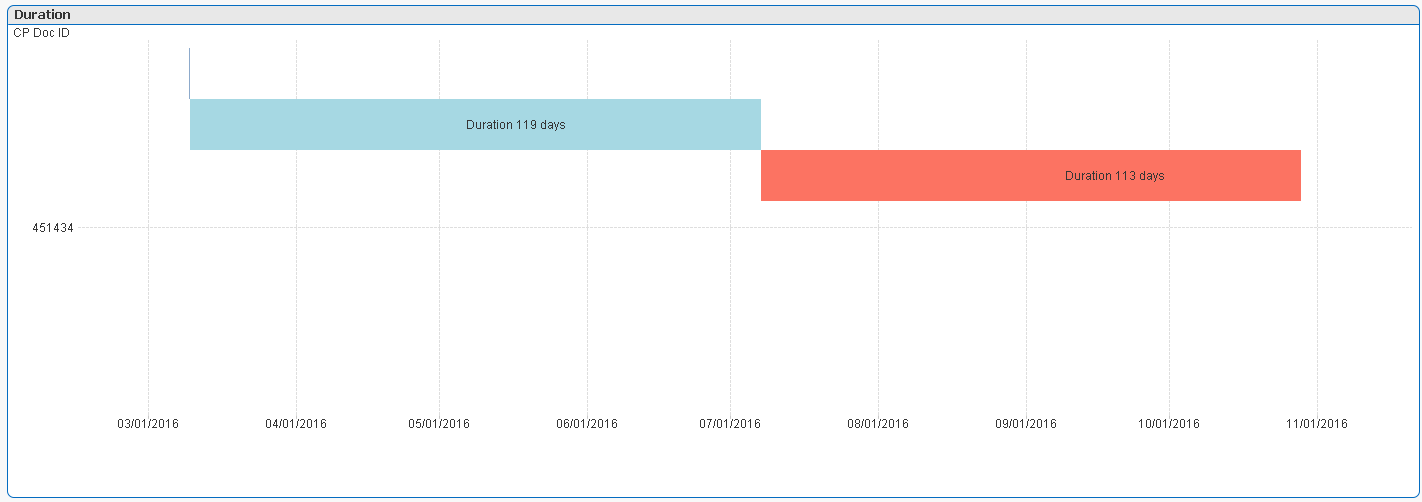
=Max({<[TL Event]>}[TL End Date Time]) - Max({<[TL Event]>}[TL Start Date Time])
=Max({<[TL Event]>}[TL Start Date Time])
Best Regards,
Vijay
- Mark as Read
- Mark as New
- Bookmark
- Permalink
- Report Inappropriate Content
Something like this for Qlik Sense?
- Mark as Read
- Mark as New
- Bookmark
- Permalink
- Report Inappropriate Content
Currently, it is not possible to make a Gantt chart in Qlik Sense if you use the native client.
But if you instead use the APIs and write your own extension, you can do it. Luckily other people have done this already and shared their result on Qlik Branch. Take a look there: http://branch.qlik.com/#!/project
- Mark as Read
- Mark as New
- Bookmark
- Permalink
- Report Inappropriate Content
Thank you .
- Mark as Read
- Mark as New
- Bookmark
- Permalink
- Report Inappropriate Content
I'm trying to implement your solution but I've come against an issue that's really strange:

The dates revert to 1900 dates as if showing the date value of the duration ex: date(460).
Have you come across this before?
Thanks,
Joseph